 2
2peptides
spectra
0.000 | 0.000
0.000 | 0.000
0.000 | 0.000
0.000 | 0.000
0.000 | 0.039
0.834 | 0.928
0.000 | 0.137
0.000 | 0.096
2peptides
spectra
0.000 | 0.022
0.978 | 1.000
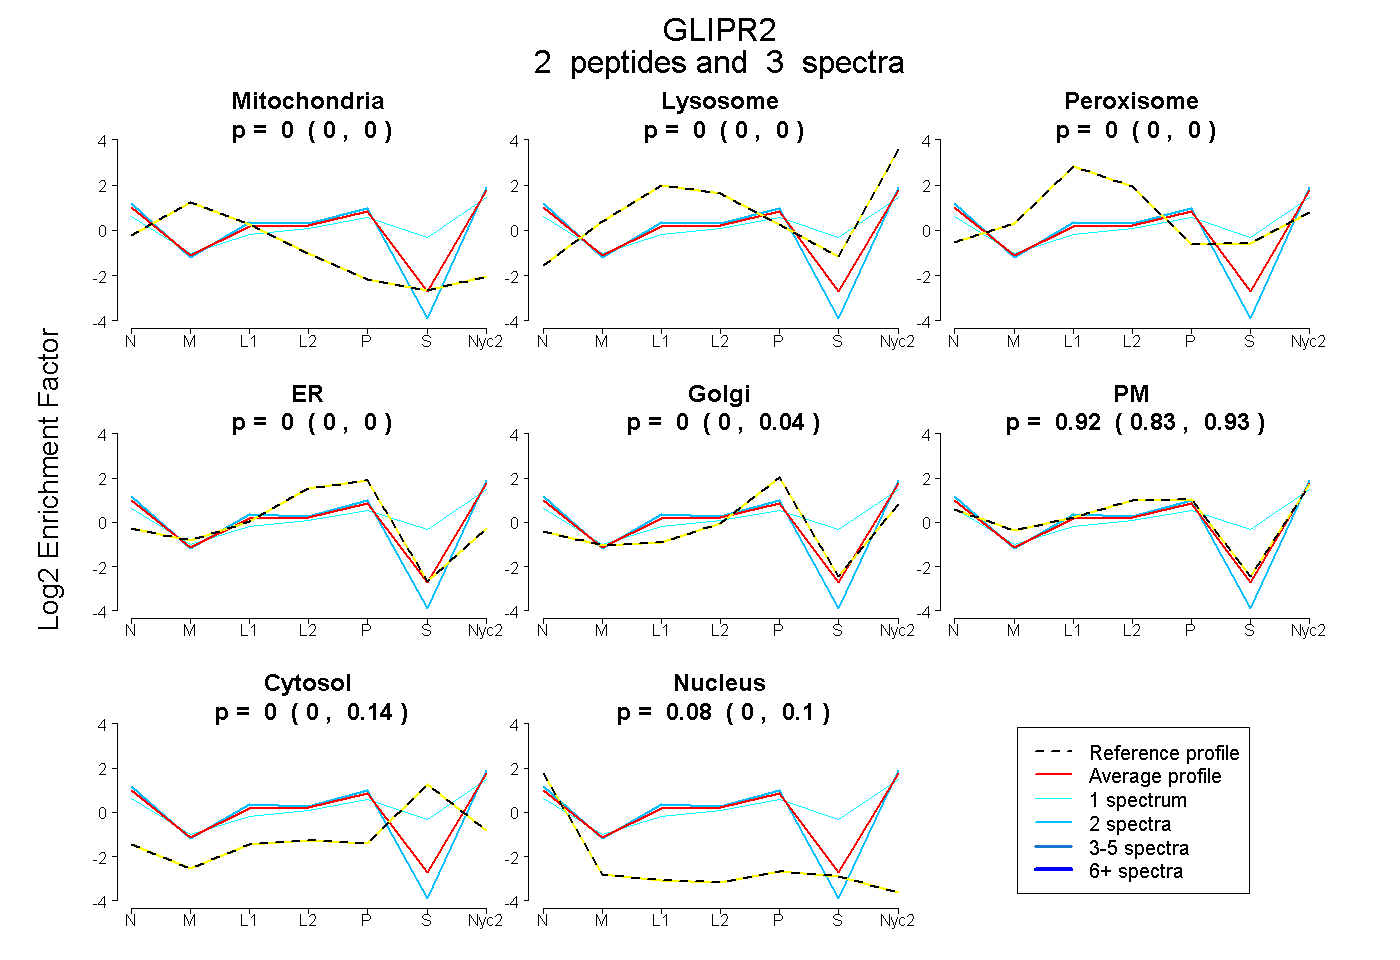
| Plot | Mito | Lyso | Perox | ER | Golgi | PM | Cytosol | Nucleus | |||||
| Expt A |
2 peptides |
3 spectra |
|
0.000 0.000 | 0.000 |
0.000 0.000 | 0.000 |
0.000 0.000 | 0.000 |
0.000 0.000 | 0.000 |
0.000 0.000 | 0.039 |
0.919 0.834 | 0.928 |
0.000 0.000 | 0.137 |
0.081 0.000 | 0.096 |
||
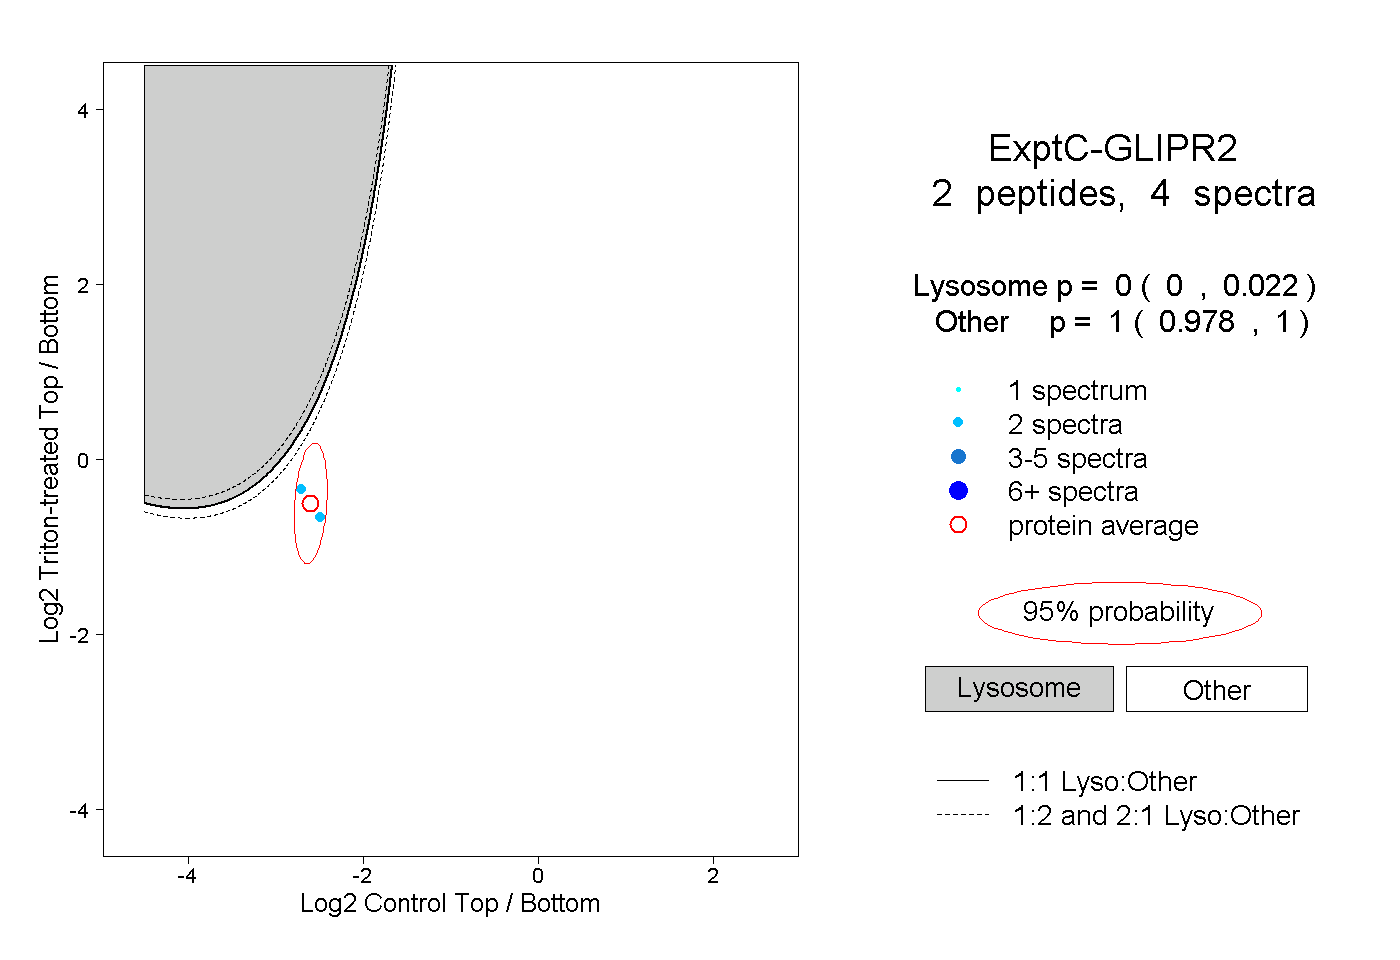
| Plot | Lyso | Other | |||||||||||
| Expt C |
2 peptides |
4 spectra |
|
0.000 0.000 | 0.022 |
1.000 0.978 | 1.000 |