 7
7peptides
spectra
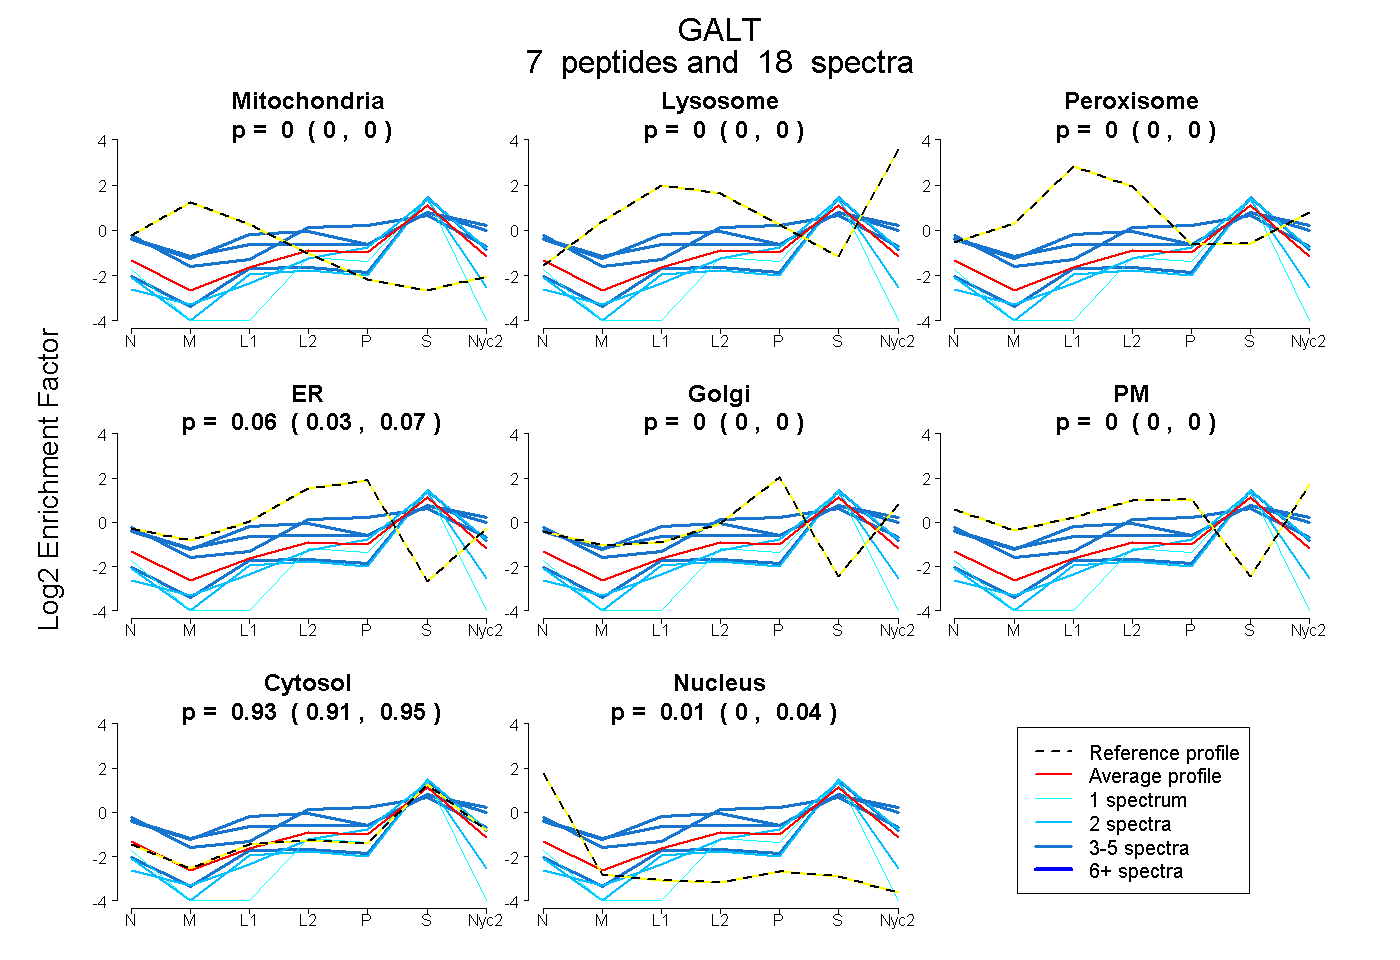
0.000 | 0.000
0.000 | 0.000
0.000 | 0.000
0.033 | 0.075
0.000 | 0.000
0.000 | 0.000
0.907 | 0.946
0.000 | 0.037
3peptides
spectra
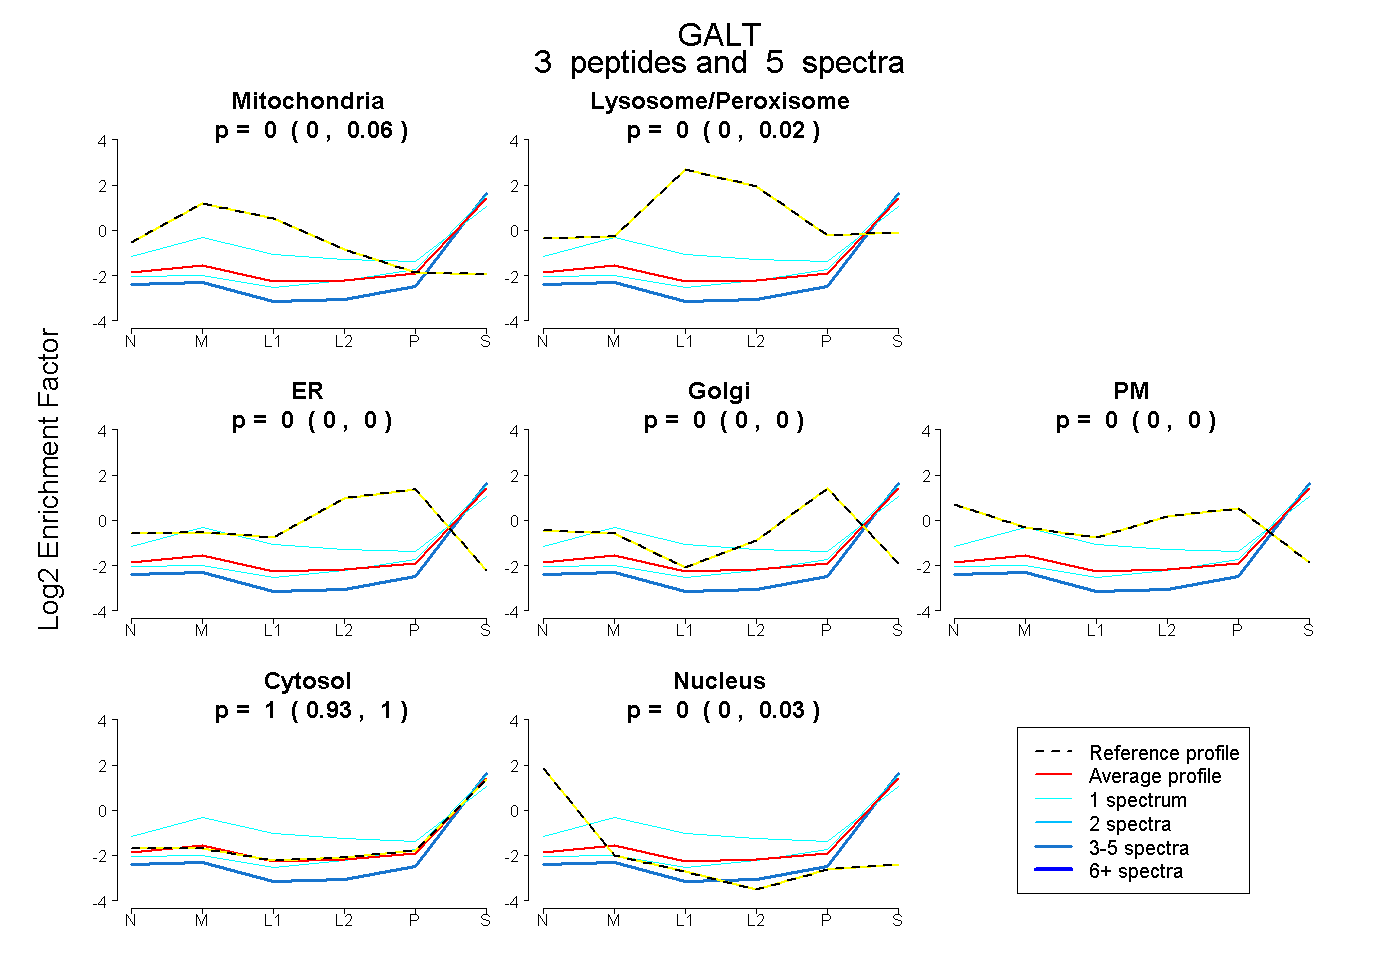
0.000 | 0.057
0.000 | 0.025
0.000 | 0.000
0.000 | 0.000
0.000 | 0.000
0.928 | 1.000
0.000 | 0.026
4peptides
spectra
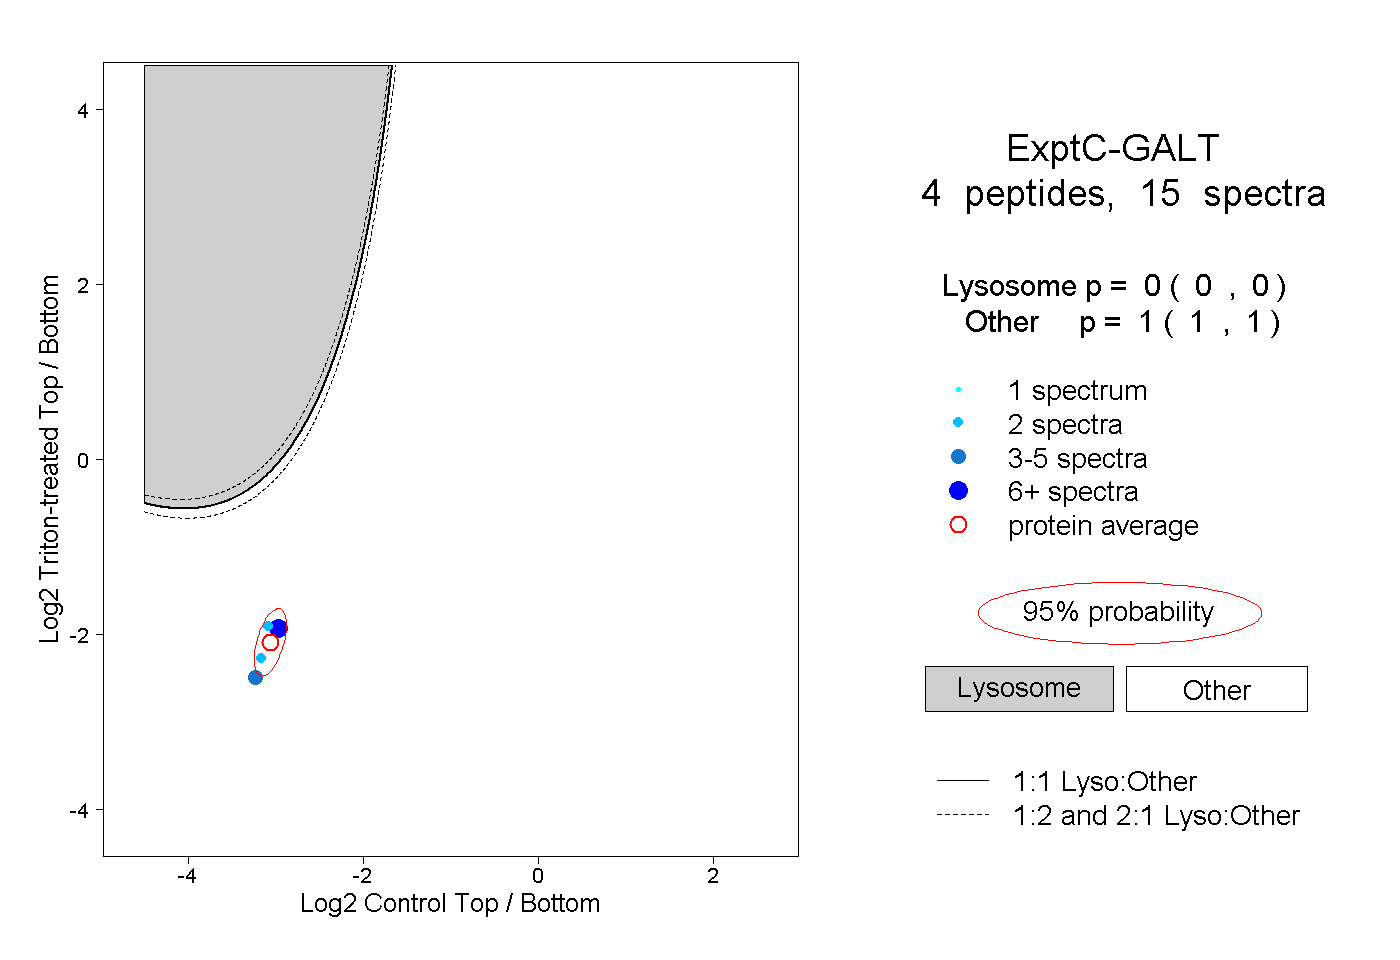
0.000 | 0.000
1.000 | 1.000
1peptide
spectra
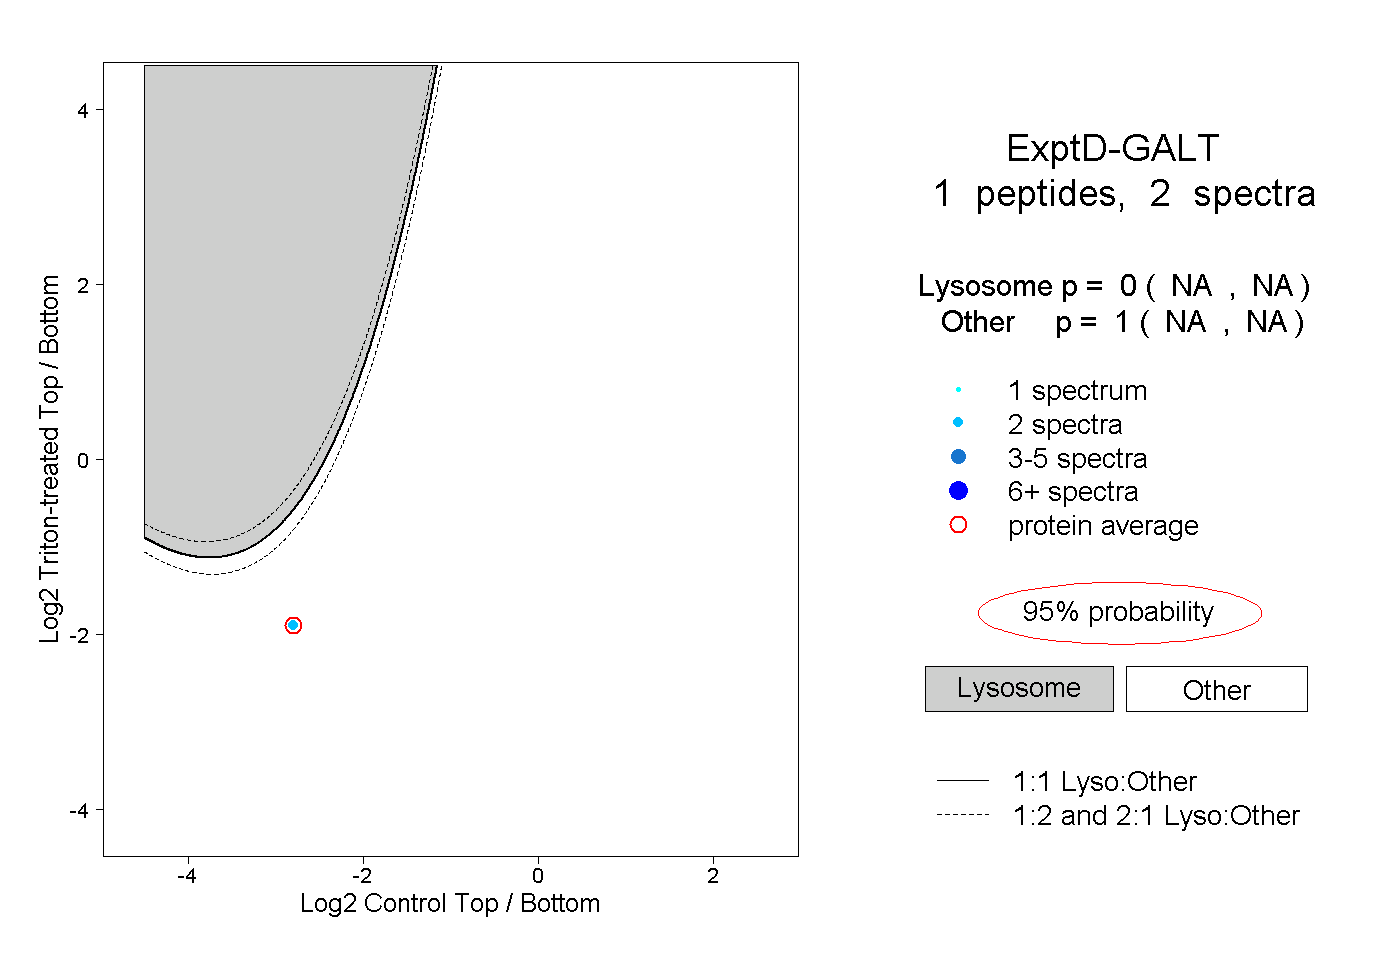
NA | NA
NA | NA