39
39peptides
spectra
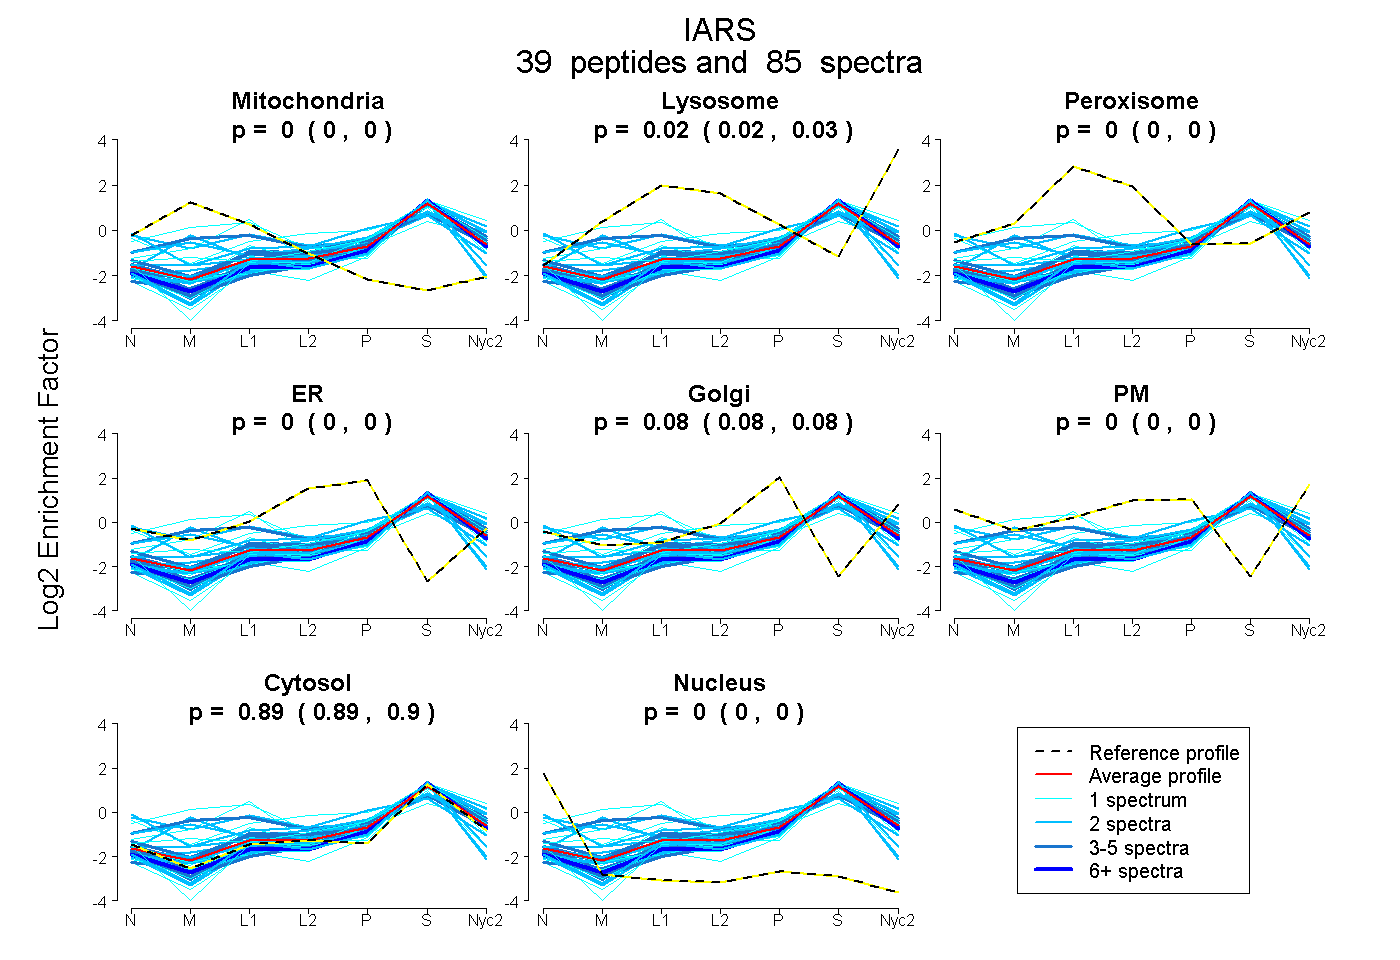
0.000 | 0.000
0.021 | 0.027
0.000 | 0.000
0.000 | 0.000
0.078 | 0.084
0.000 | 0.000
0.892 | 0.896
0.000 | 0.000
13peptides
spectra
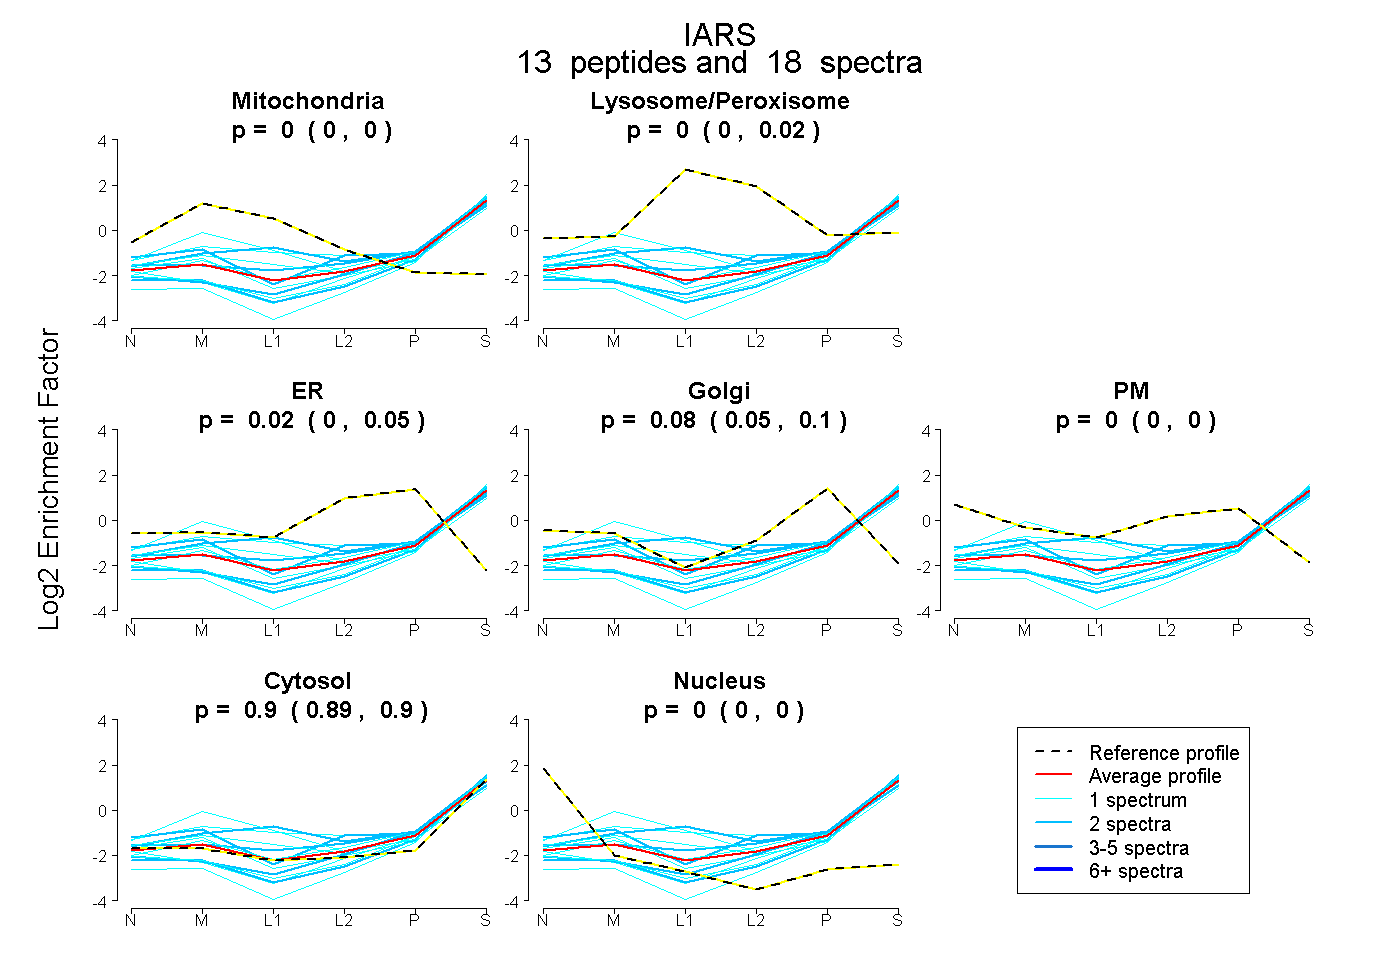
0.000 | 0.000
0.000 | 0.019
0.000 | 0.047
0.046 | 0.105
0.000 | 0.000
0.886 | 0.904
0.000 | 0.000