DHX36
[ENSRNOP00000019824]
Main page
| | | Plot |
Mito |
Lyso |
|
Perox |
ER |
Golgi |
PM |
Cytosol |
Nucleus |
|
| Expt A |
 17
17
peptides |
33
spectra |
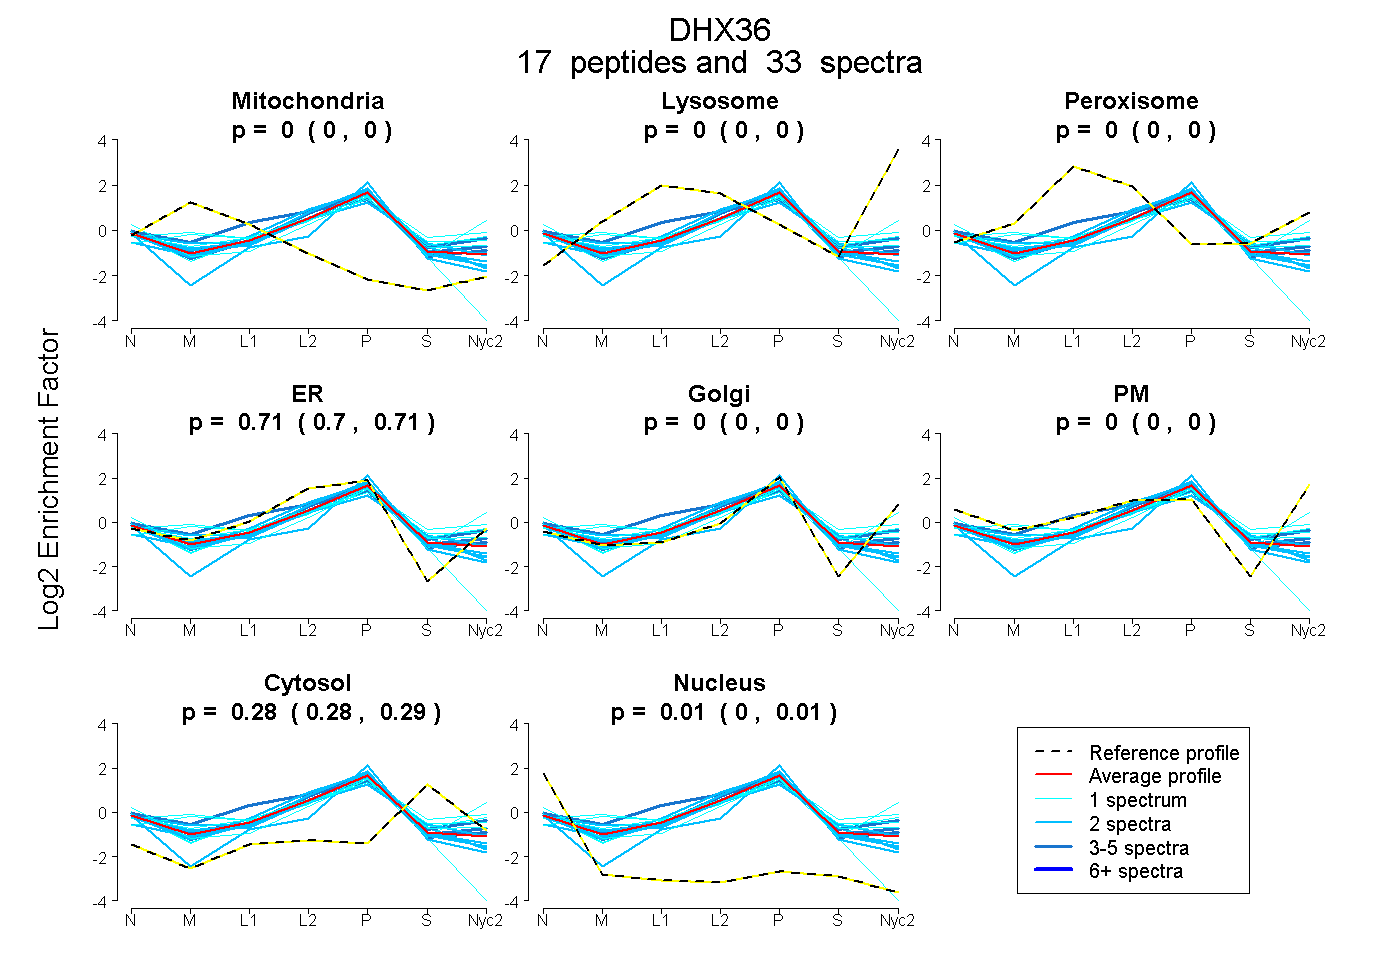 |
0.000
0.000 | 0.000 |
0.000
0.000 | 0.000 |
|
0.000
0.000 | 0.000 |
0.708
0.704 | 0.711 |
0.000
0.000 | 0.000 |
0.000
0.000 | 0.000 |
0.284
0.279 | 0.288 |
0.008
0.004 | 0.012 |
|
| | | Plot |
Mito |
|
Lyso or Perox |
|
ER |
Golgi |
PM |
Cytosol |
Nucleus |
|
| Expt B |
4
peptides |
6
spectra |
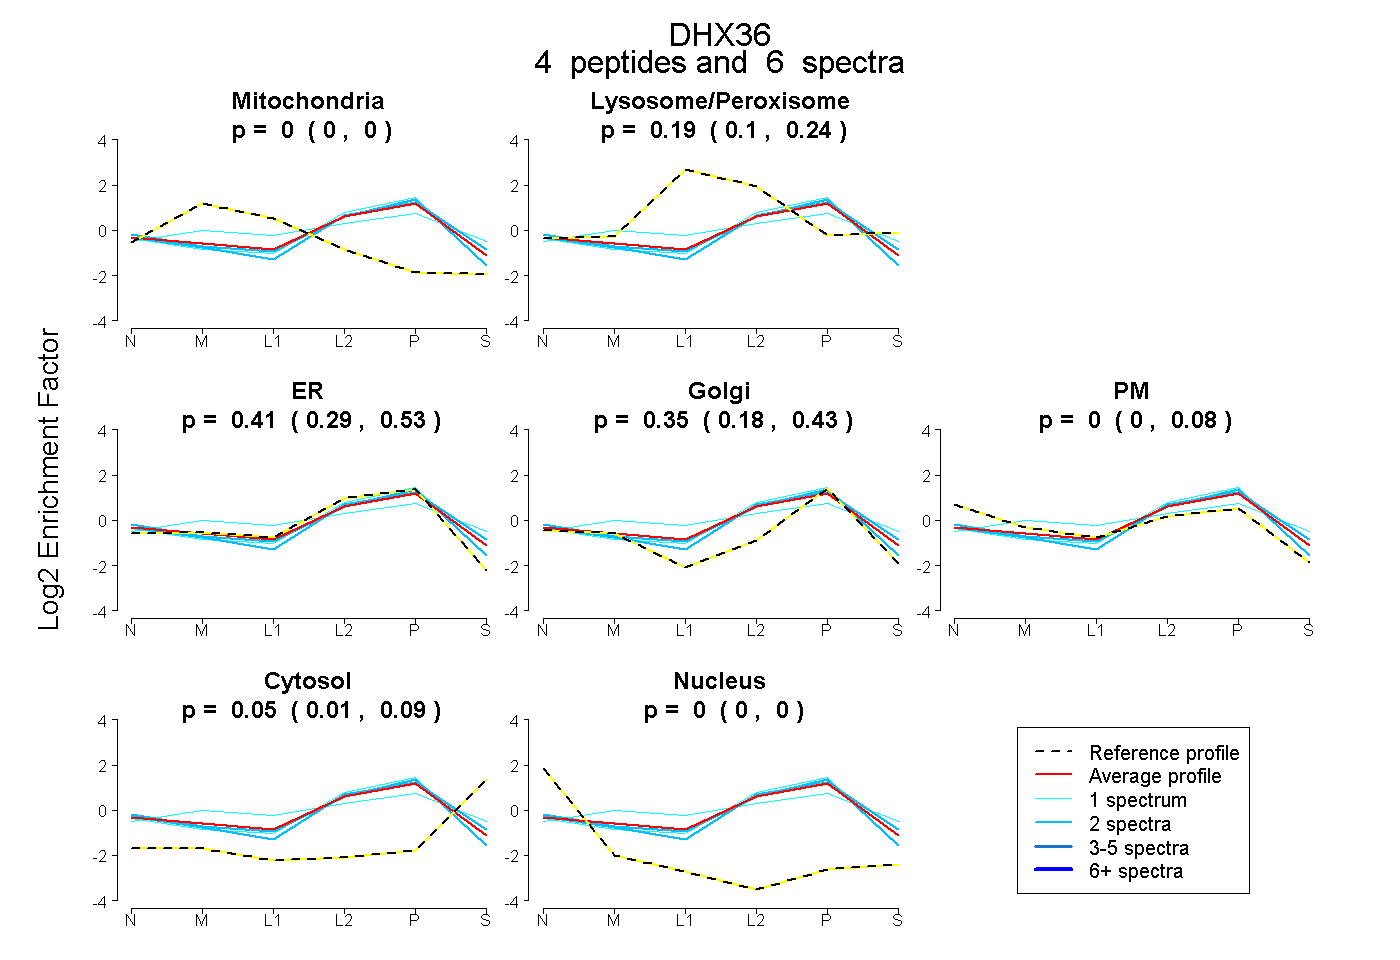 |
0.000
0.000 | 0.000 |
|
0.187
0.099 | 0.238 |
|
0.413
0.294 | 0.533 |
0.345
0.180 | 0.434 |
0.005
0.000 | 0.080 |
0.050
0.010 | 0.089 |
0.000
0.000 | 0.000 |
|
| | | Plot |
|
Lyso |
|
|
|
|
|
|
|
Other |
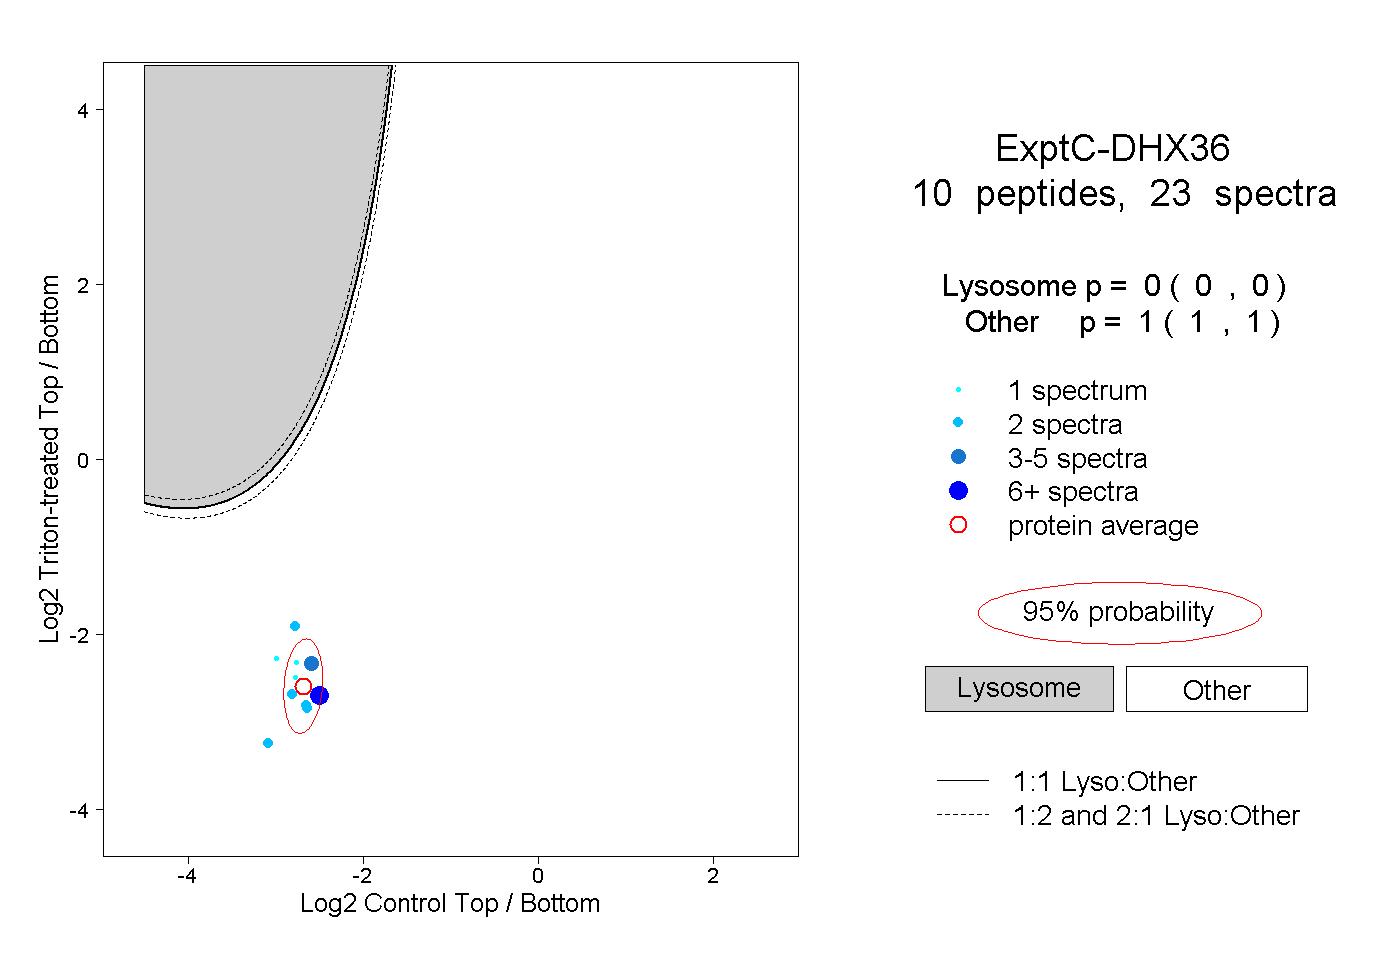
| Expt C |
10
peptides |
23
spectra |
 |
|
0.000
0.000 | 0.000 |
|
|
|
|
|
|
|
1.000
1.000 | 1.000 |
| 2 spectra, LPVEPHIGK |
|
0.000 |
|
|
|
|
|
|
|
1.000 |
| 2 spectra, IVCTQPR |
|
0.000 |
|
|
|
|
|
|
|
1.000 |
| 6 spectra, IAHLVK |
|
0.000 |
|
|
|
|
|
|
|
1.000 |
| 2 spectra, WPAYIK |
|
0.000 |
|
|
|
|
|
|
|
1.000 |
| 4 spectra, ANINSDNEK |
|
0.000 |
|
|
|
|
|
|
|
1.000 |
| 2 spectra, DLLHFR |
|
0.000 |
|
|
|
|
|
|
|
1.000 |
| 1 spectrum, ELDILLQEK |
|
0.000 |
|
|
|
|
|
|
|
1.000 |
| 1 spectrum, VILMSATLNAEK |
|
0.000 |
|
|
|
|
|
|
|
1.000 |
| 2 spectra, LGGIAYFLSR |
|
0.000 |
|
|
|
|
|
|
|
1.000 |
| 1 spectrum, AVVHMDER |
|
0.000 |
|
|
|
|
|
|
|
1.000 |
| | | Plot |
|
Lyso |
|
|
|
|
|
|
|
Other |
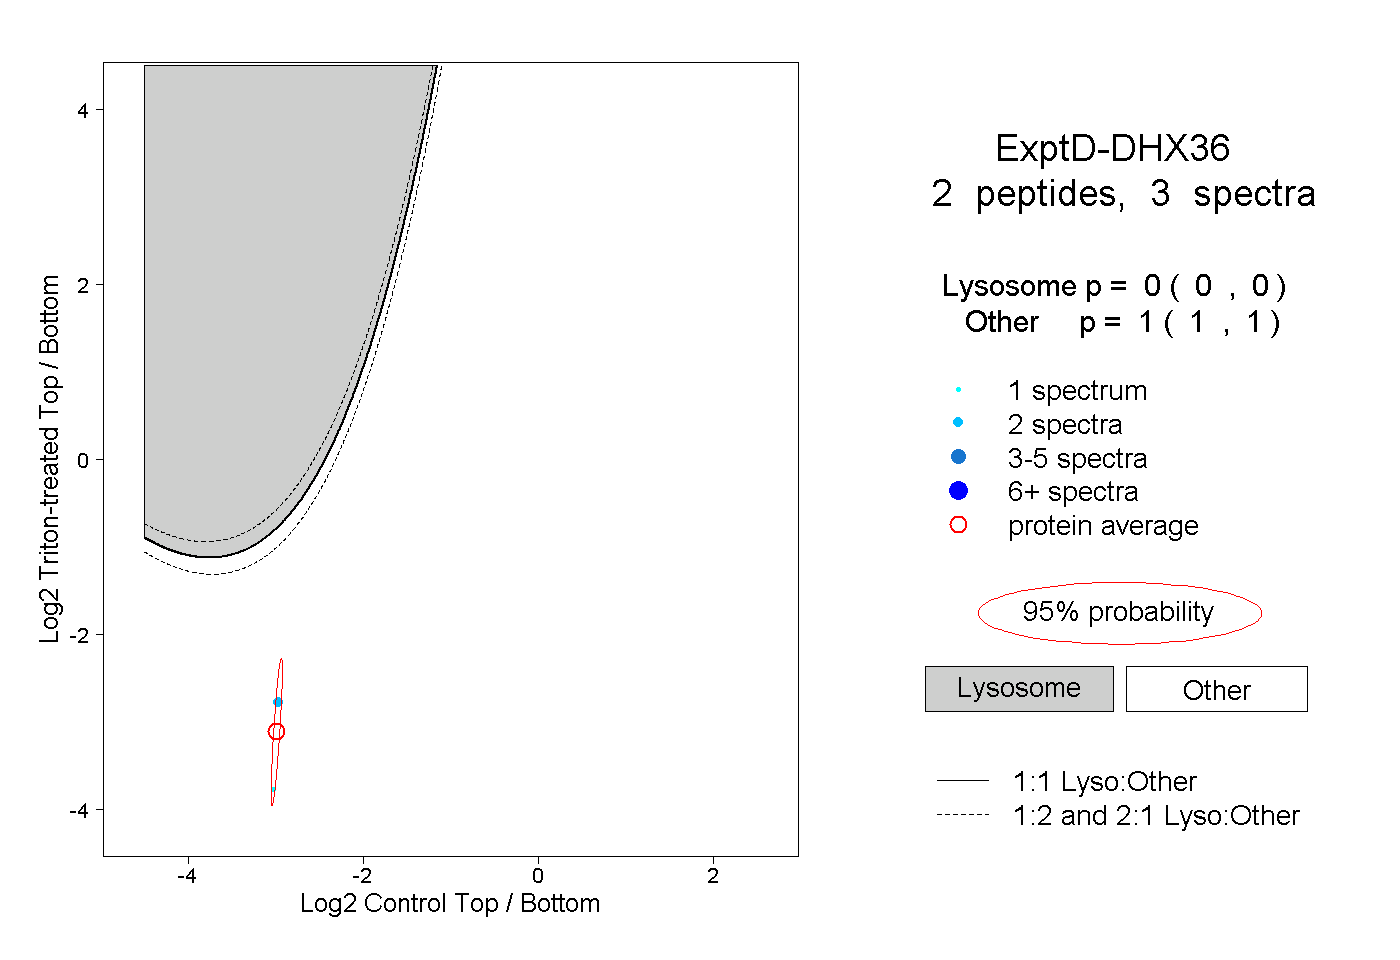
| Expt D |
2
peptides |
3
spectra |
 |
|
0.000
0.000 | 0.000 |
|
|
|
|
|
|
|
1.000
1.000 | 1.000 |