17
17peptides
spectra
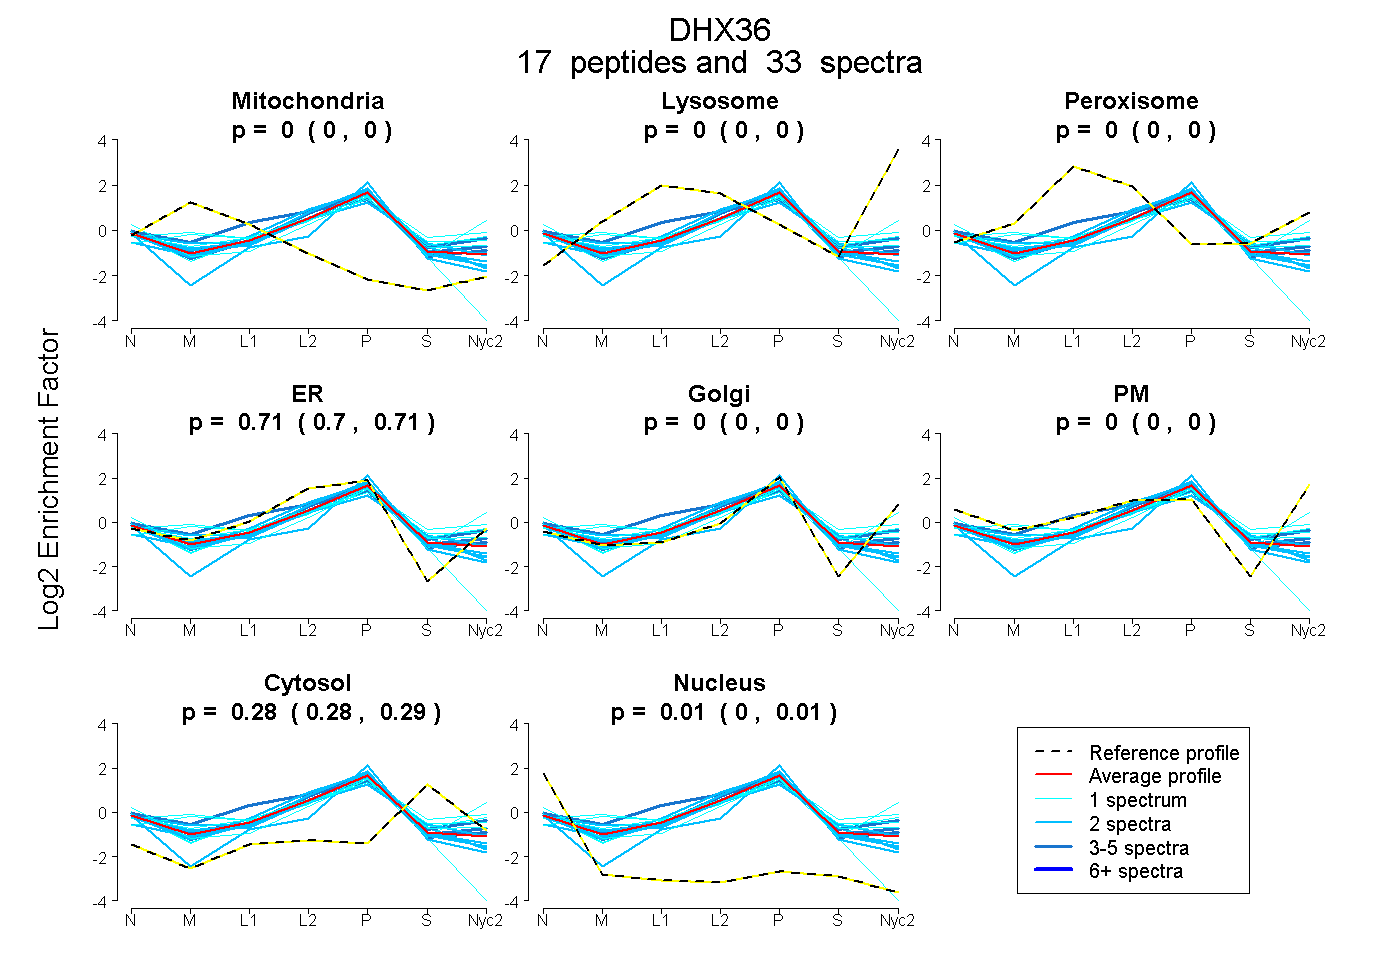
0.000 | 0.000
0.000 | 0.000
0.000 | 0.000
0.704 | 0.711
0.000 | 0.000
0.000 | 0.000
0.279 | 0.288
0.004 | 0.012
4peptides
spectra
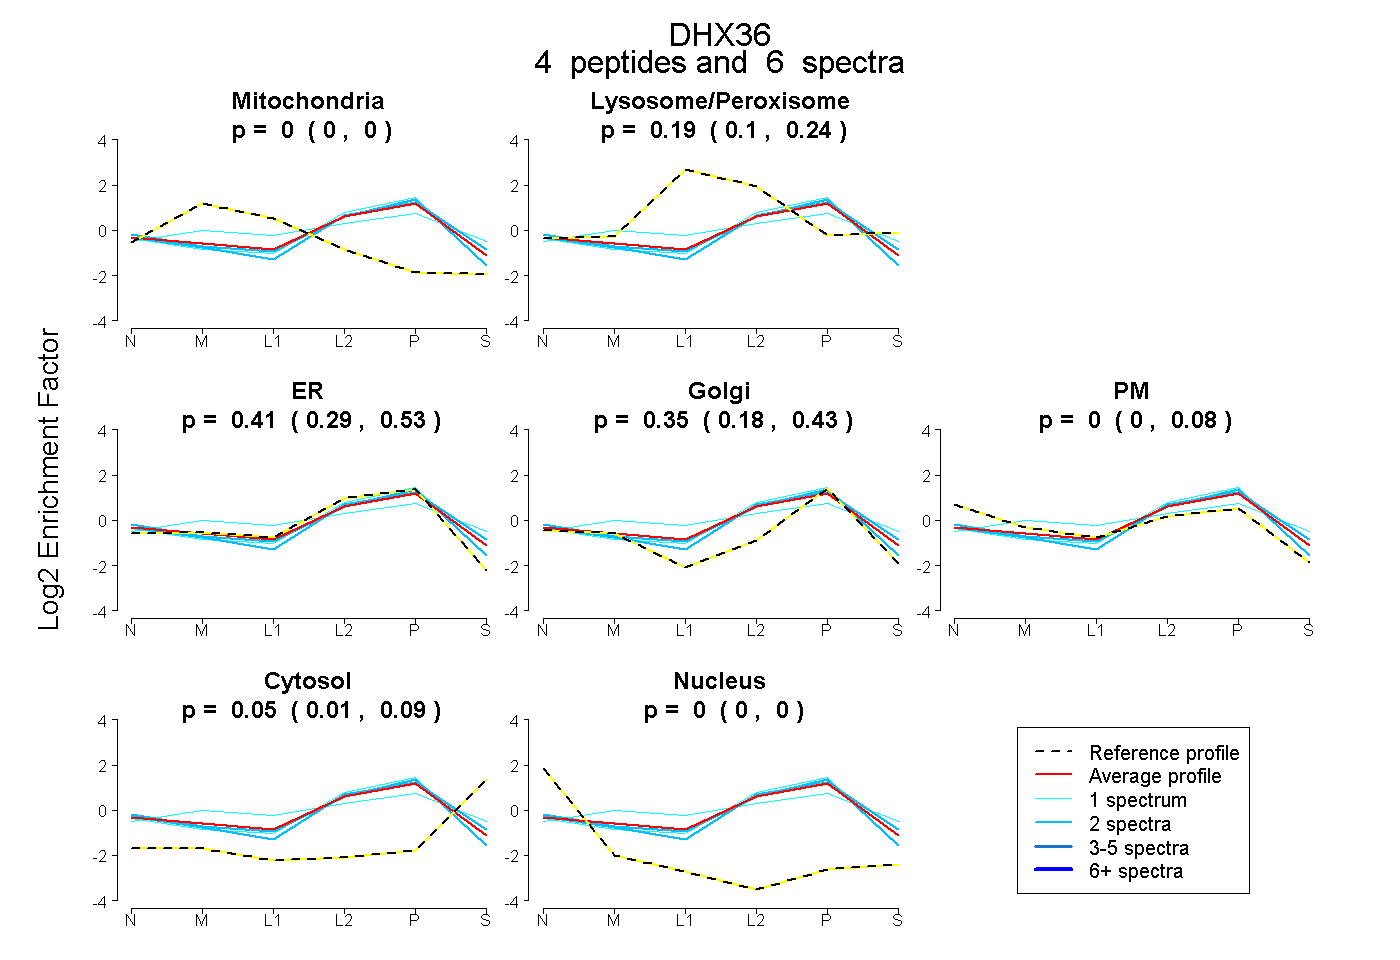
0.000 | 0.000
0.099 | 0.238
0.294 | 0.533
0.180 | 0.434
0.000 | 0.080
0.010 | 0.089
0.000 | 0.000