 17
17peptides
spectra
0.000 | 0.000
0.000 | 0.000
0.000 | 0.000
0.704 | 0.711
0.000 | 0.000
0.000 | 0.000
0.279 | 0.288
0.004 | 0.012
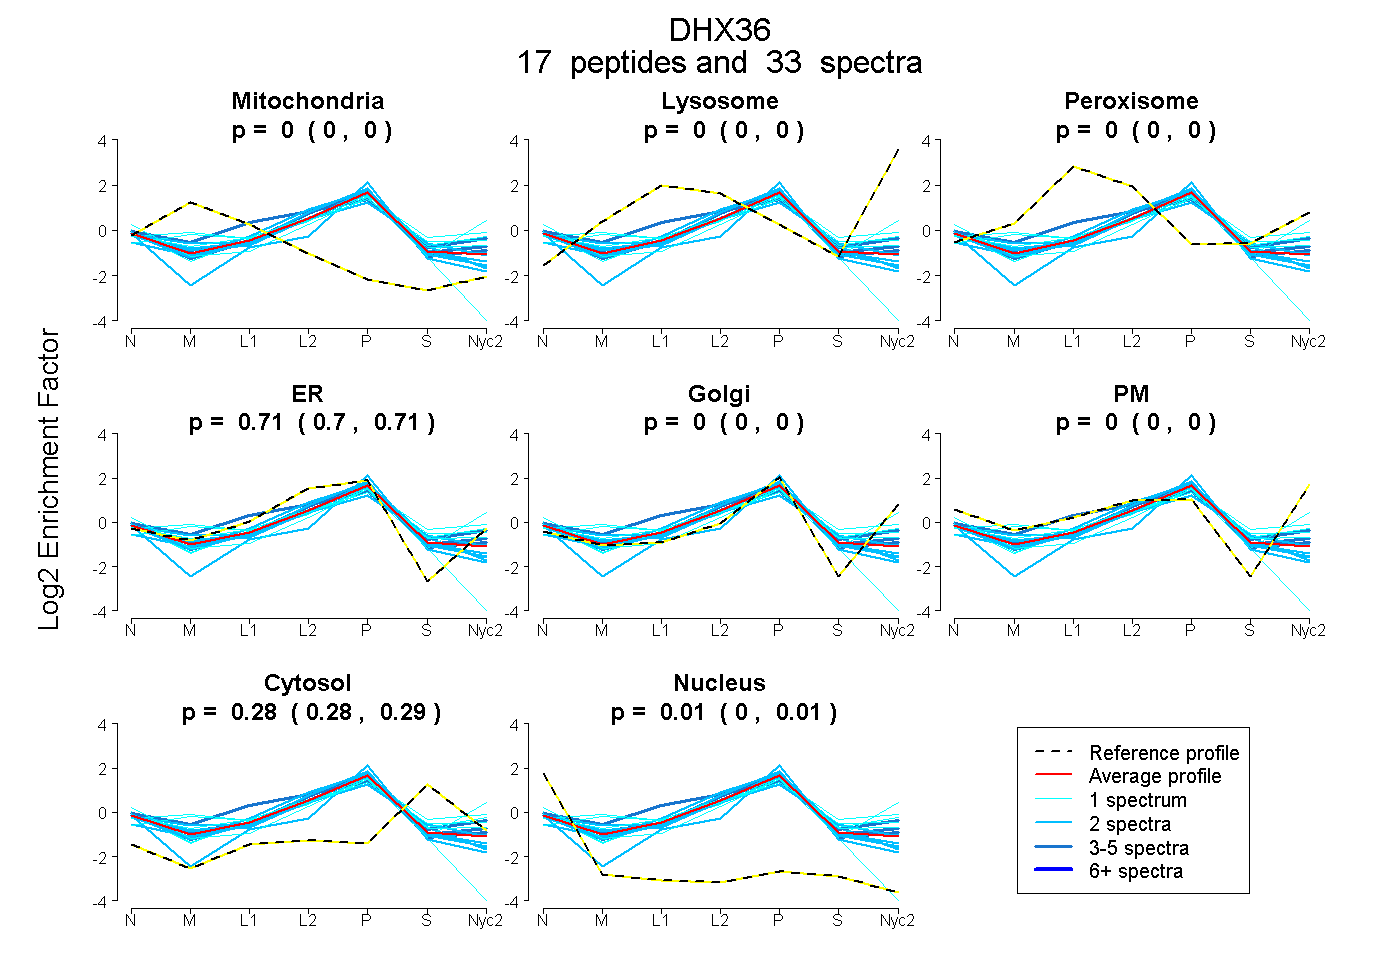
| Plot | Mito | Lyso | Perox | ER | Golgi | PM | Cytosol | Nucleus | |||||
| Expt A |
17 peptides |
33 spectra |
|
0.000 0.000 | 0.000 |
0.000 0.000 | 0.000 |
0.000 0.000 | 0.000 |
0.708 0.704 | 0.711 |
0.000 0.000 | 0.000 |
0.000 0.000 | 0.000 |
0.284 0.279 | 0.288 |
0.008 0.004 | 0.012 |
| 1 spectrum, YFPEQK | 0.013 | 0.000 | 0.132 | 0.404 | 0.189 | 0.000 | 0.262 | 0.000 | ||
| 2 spectra, LPVEPHIGK | 0.000 | 0.000 | 0.000 | 0.692 | 0.000 | 0.000 | 0.263 | 0.044 | ||
| 3 spectra, GFMQGHVNR | 0.000 | 0.000 | 0.207 | 0.534 | 0.066 | 0.000 | 0.192 | 0.000 | ||
| 2 spectra, HPAHLK | 0.000 | 0.000 | 0.000 | 0.550 | 0.079 | 0.000 | 0.230 | 0.140 | ||
| 1 spectrum, GIGSACR | 0.000 | 0.000 | 0.074 | 0.372 | 0.245 | 0.000 | 0.309 | 0.000 | ||
| 1 spectrum, WPAYIK | 0.000 | 0.000 | 0.101 | 0.449 | 0.212 | 0.000 | 0.238 | 0.000 | ||
| 4 spectra, ANINSDNEK | 0.000 | 0.000 | 0.000 | 0.670 | 0.061 | 0.000 | 0.269 | 0.000 | ||
| 2 spectra, ELDILLQEK | 0.000 | 0.000 | 0.000 | 0.669 | 0.000 | 0.000 | 0.325 | 0.006 | ||
| 2 spectra, LGGIAYFLSR | 0.048 | 0.000 | 0.000 | 0.622 | 0.000 | 0.000 | 0.330 | 0.000 | ||
| 1 spectrum, ASLLDDYQLPEILR | 0.000 | 0.000 | 0.000 | 0.722 | 0.000 | 0.000 | 0.242 | 0.036 | ||
| 2 spectra, IAHLVK | 0.000 | 0.000 | 0.000 | 0.745 | 0.000 | 0.000 | 0.246 | 0.009 | ||
| 2 spectra, IVCTQPR | 0.000 | 0.000 | 0.000 | 0.730 | 0.000 | 0.000 | 0.237 | 0.033 | ||
| 5 spectra, DLLHFR | 0.000 | 0.000 | 0.000 | 0.747 | 0.000 | 0.000 | 0.240 | 0.013 | ||
| 1 spectrum, YIEMQR | 0.000 | 0.000 | 0.000 | 0.476 | 0.200 | 0.000 | 0.290 | 0.034 | ||
| 2 spectra, GQFAEHLLGAGFVSSR | 0.000 | 0.000 | 0.000 | 0.723 | 0.000 | 0.000 | 0.264 | 0.013 | ||
| 1 spectrum, AVICAGLYPK | 0.000 | 0.000 | 0.000 | 0.653 | 0.000 | 0.000 | 0.098 | 0.249 | ||
| 1 spectrum, IECPHPVDWNDTK | 0.012 | 0.000 | 0.226 | 0.037 | 0.651 | 0.000 | 0.074 | 0.000 |
| Plot | Mito | Lyso or Perox | ER | Golgi | PM | Cytosol | Nucleus | ||||||
| Expt B |
4 peptides |
6 spectra |
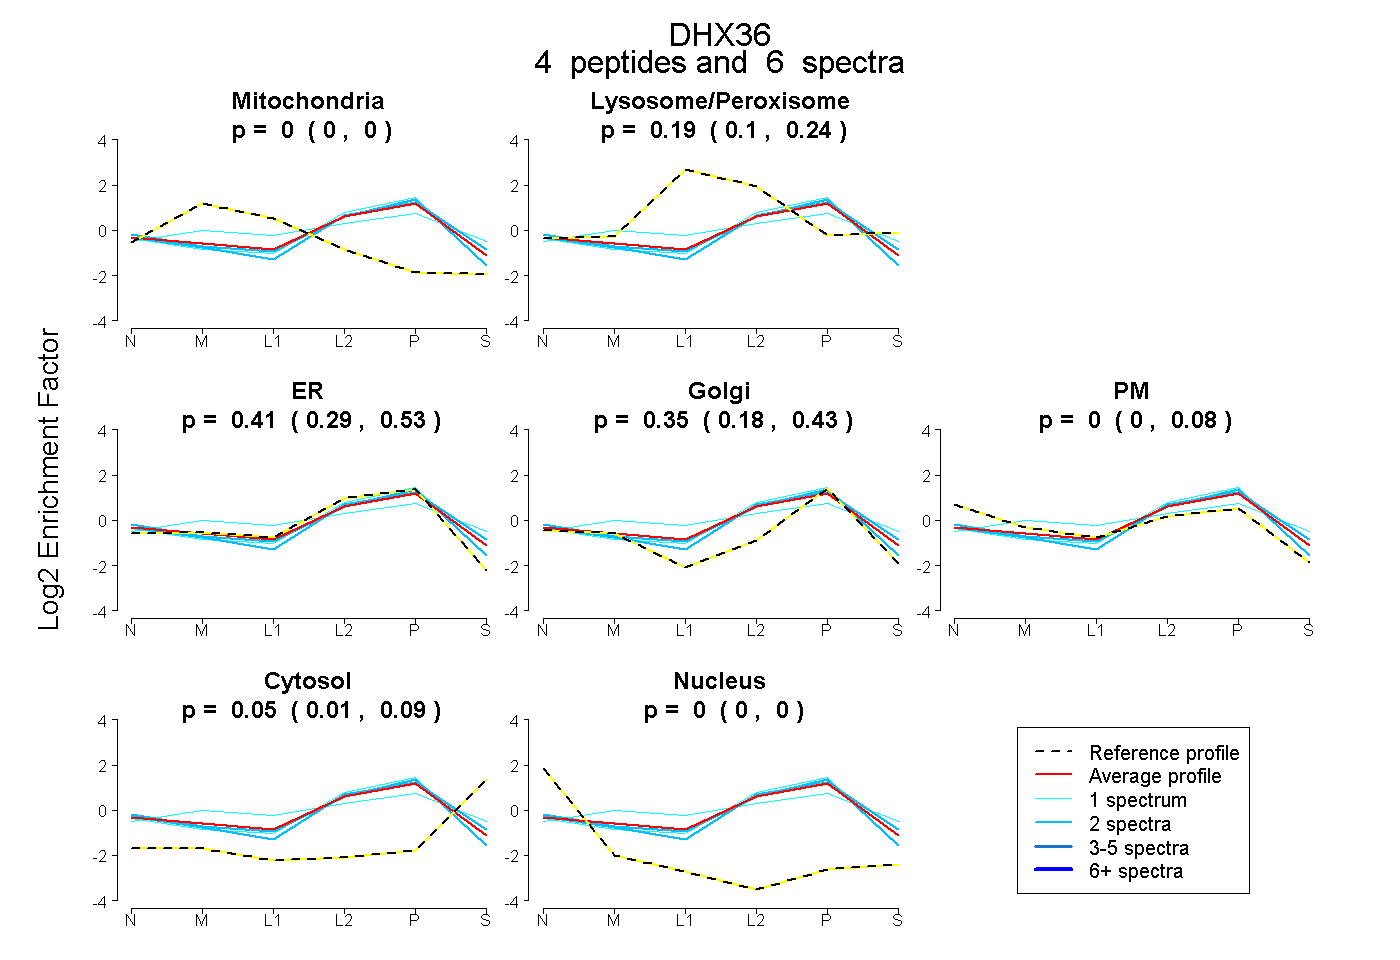 |
0.000 0.000 | 0.000 |
0.187 0.099 | 0.238 |
0.413 0.294 | 0.533 |
0.345 0.180 | 0.434 |
0.005 0.000 | 0.080 |
0.050 0.010 | 0.089 |
0.000 0.000 | 0.000 |
|||
| Plot | Lyso | Other | |||||||||||
| Expt C |
10 peptides |
23 spectra |
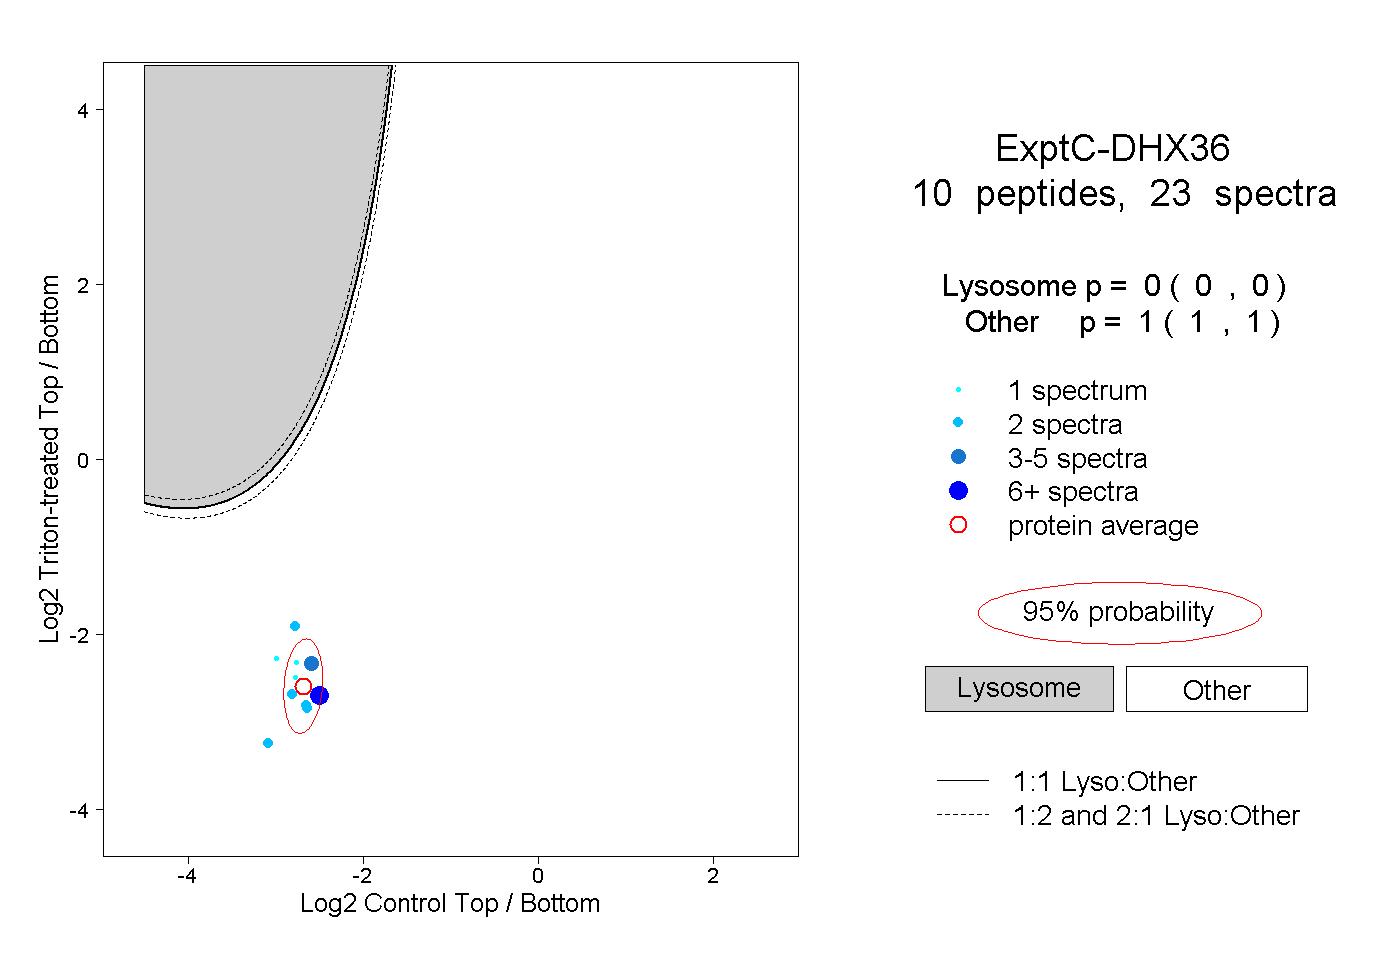 |
0.000 0.000 | 0.000 |
1.000 1.000 | 1.000 |
||||||||
| Plot | Lyso | Other | |||||||||||
| Expt D |
2 peptides |
3 spectra |
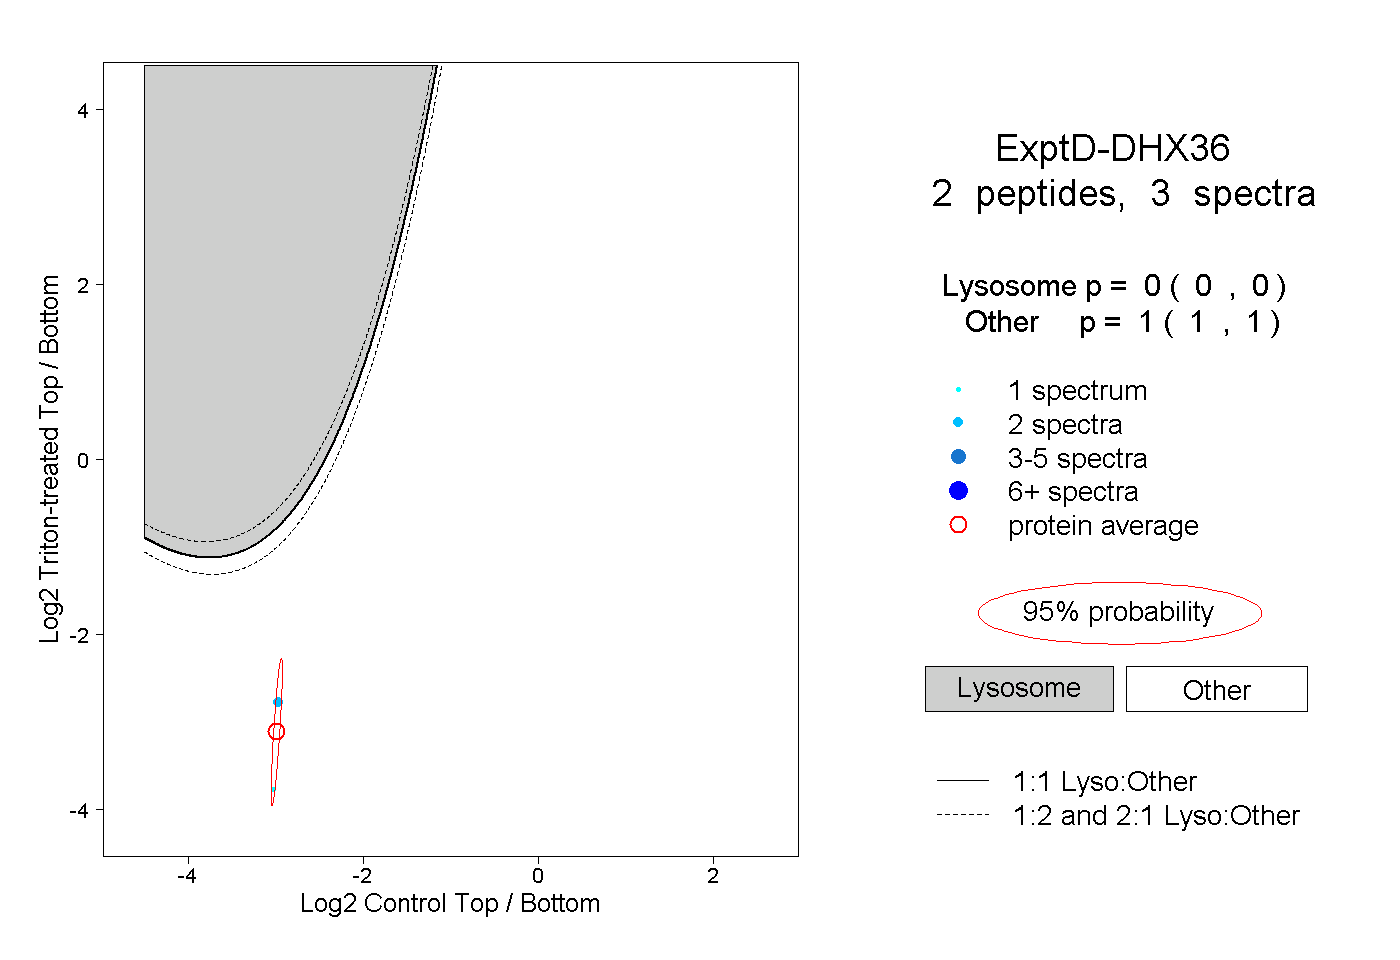 |
0.000 0.000 | 0.000 |
1.000 1.000 | 1.000 |