 12
12peptides
spectra
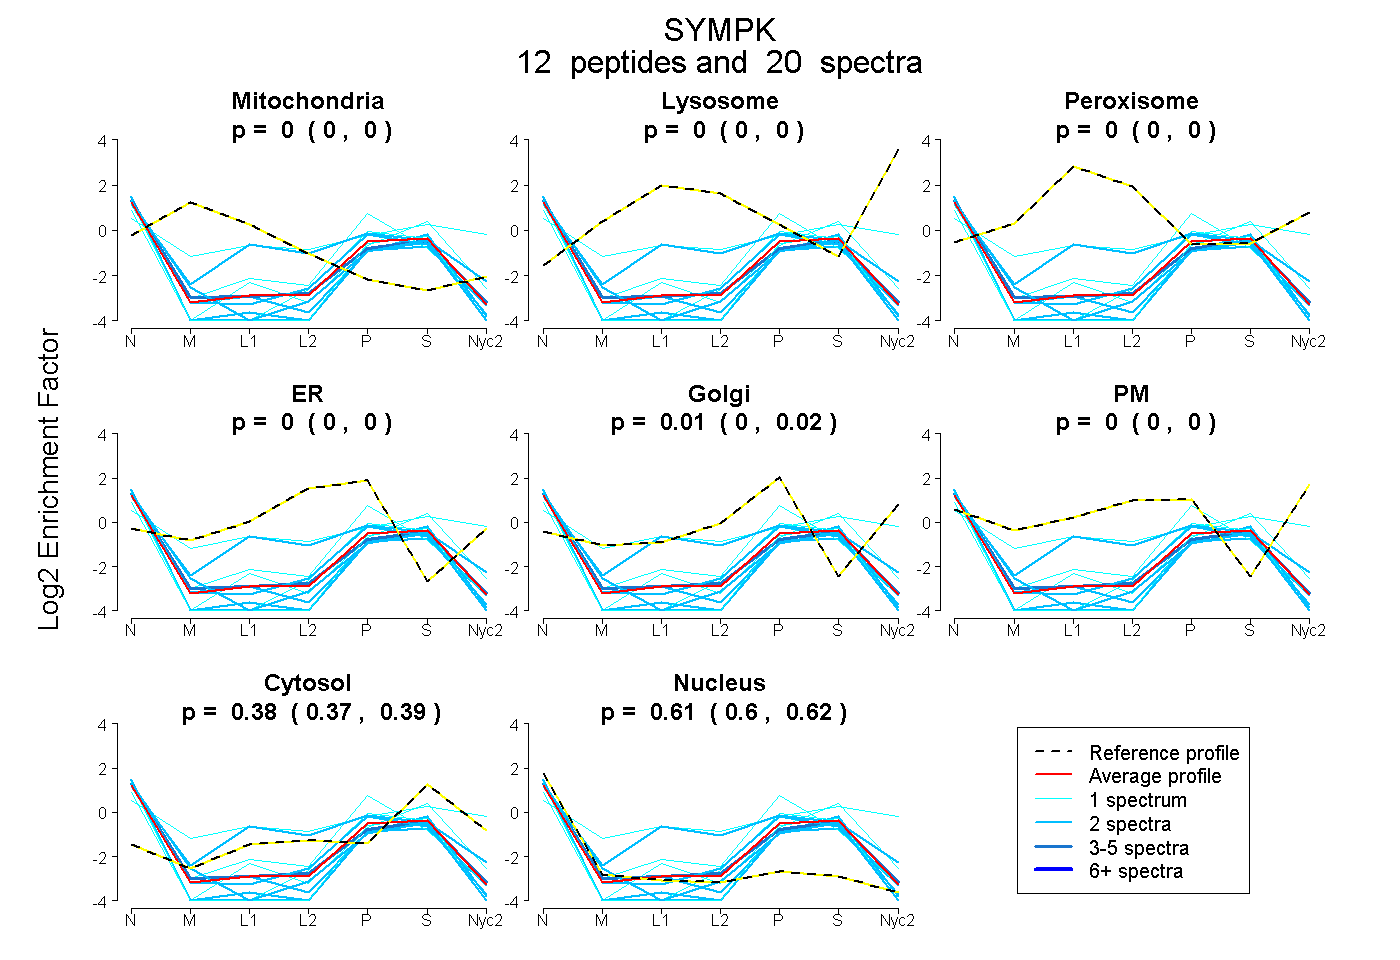
0.000 | 0.000
0.000 | 0.000
0.000 | 0.000
0.000 | 0.000
0.000 | 0.023
0.000 | 0.000
0.368 | 0.386
0.596 | 0.622
1peptide
spectrum
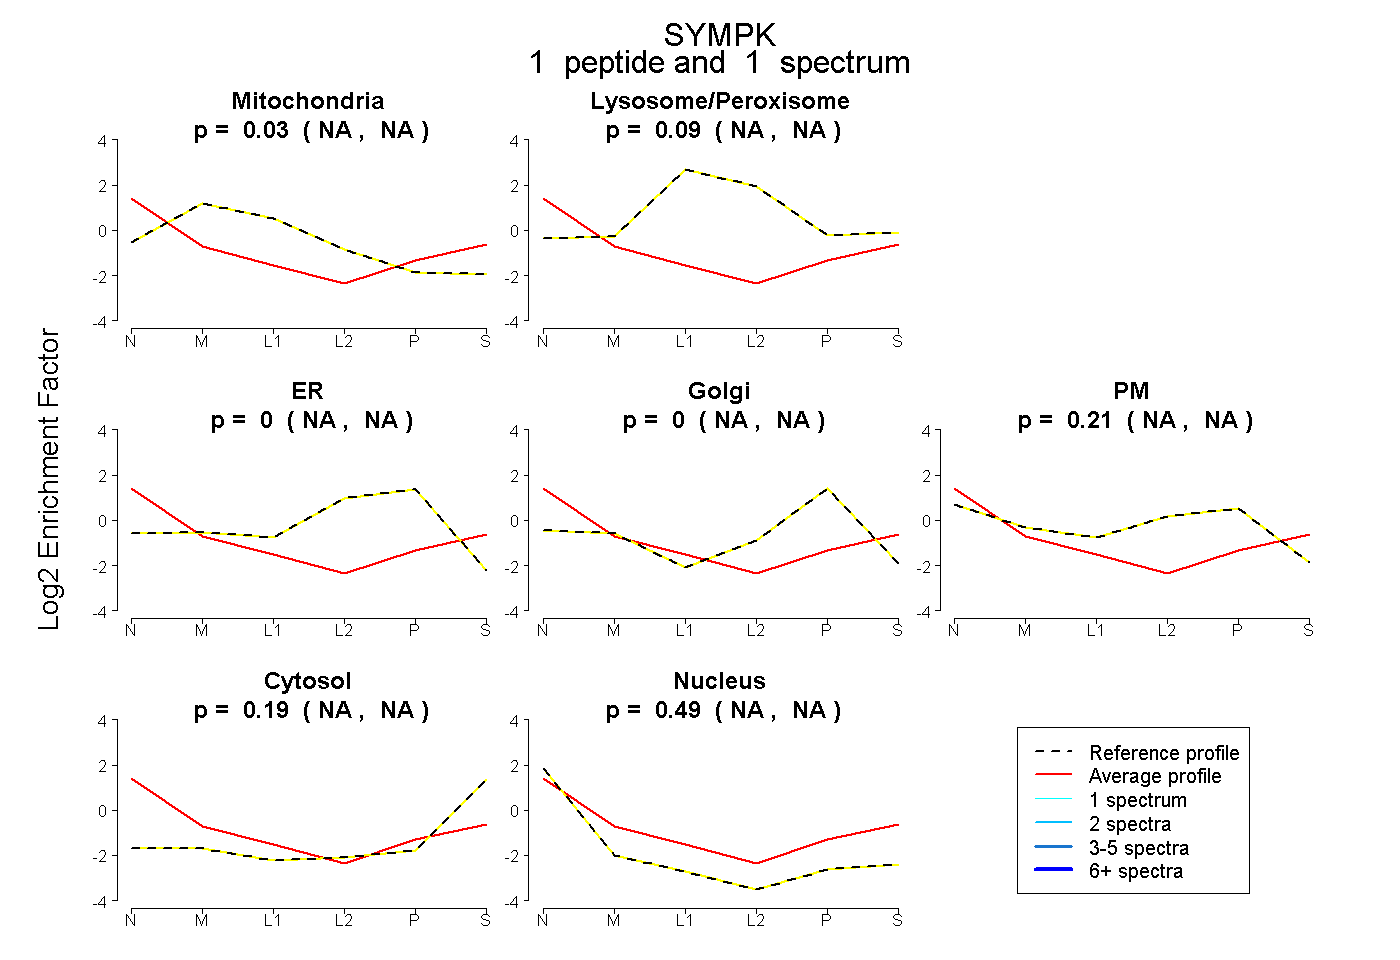
NA | NA
NA | NA
NA | NA
NA | NA
NA | NA
NA | NA
NA | NA
| Plot | Mito | Lyso | Perox | ER | Golgi | PM | Cytosol | Nucleus | |||||
| Expt A |
12 peptides |
20 spectra |
|
0.000 0.000 | 0.000 |
0.000 0.000 | 0.000 |
0.000 0.000 | 0.000 |
0.000 0.000 | 0.000 |
0.011 0.000 | 0.023 |
0.000 0.000 | 0.000 |
0.378 0.368 | 0.386 |
0.611 0.596 | 0.622 |
||
| Plot | Mito | Lyso or Perox | ER | Golgi | PM | Cytosol | Nucleus | ||||||
| Expt B |
1 peptide |
1 spectrum |
|
0.025 NA | NA |
0.087 NA | NA |
0.000 NA | NA |
0.000 NA | NA |
0.211 NA | NA |
0.189 NA | NA |
0.487 NA | NA |