 3
3peptides
spectra
0.000 | 0.000
0.000 | 0.000
0.000 | 0.051
0.149 | 0.307
0.000 | 0.000
0.000 | 0.155
0.545 | 0.606
0.061 | 0.140
1peptide
spectrum
NA | NA
NA | NA
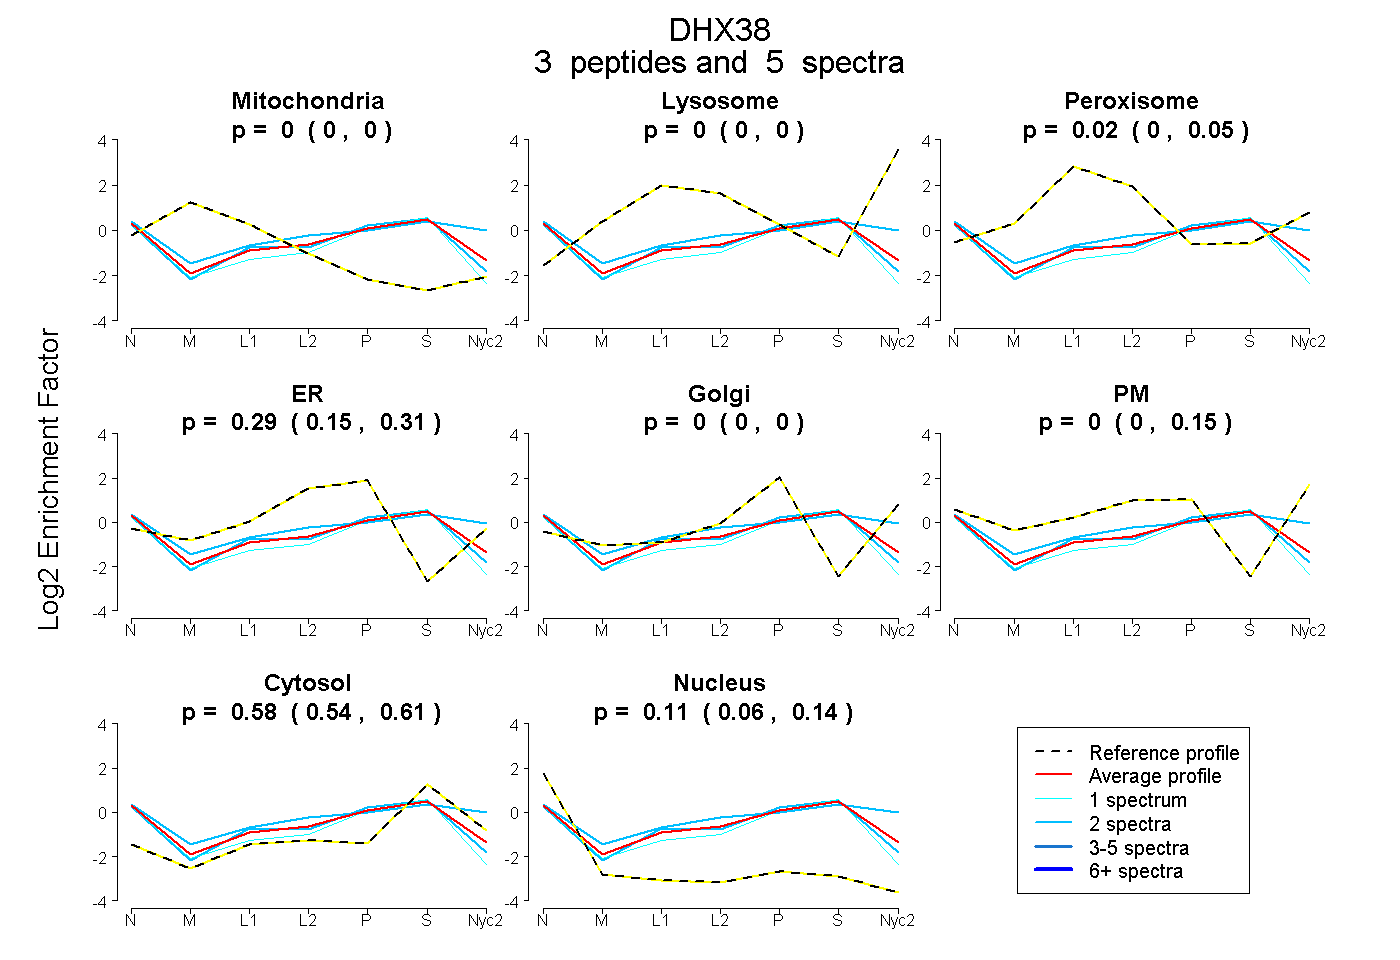
| Plot | Mito | Lyso | Perox | ER | Golgi | PM | Cytosol | Nucleus | |||||
| Expt A |
3 peptides |
5 spectra |
|
0.000 0.000 | 0.000 |
0.000 0.000 | 0.000 |
0.025 0.000 | 0.051 |
0.291 0.149 | 0.307 |
0.000 0.000 | 0.000 |
0.000 0.000 | 0.155 |
0.579 0.545 | 0.606 |
0.105 0.061 | 0.140 |
||
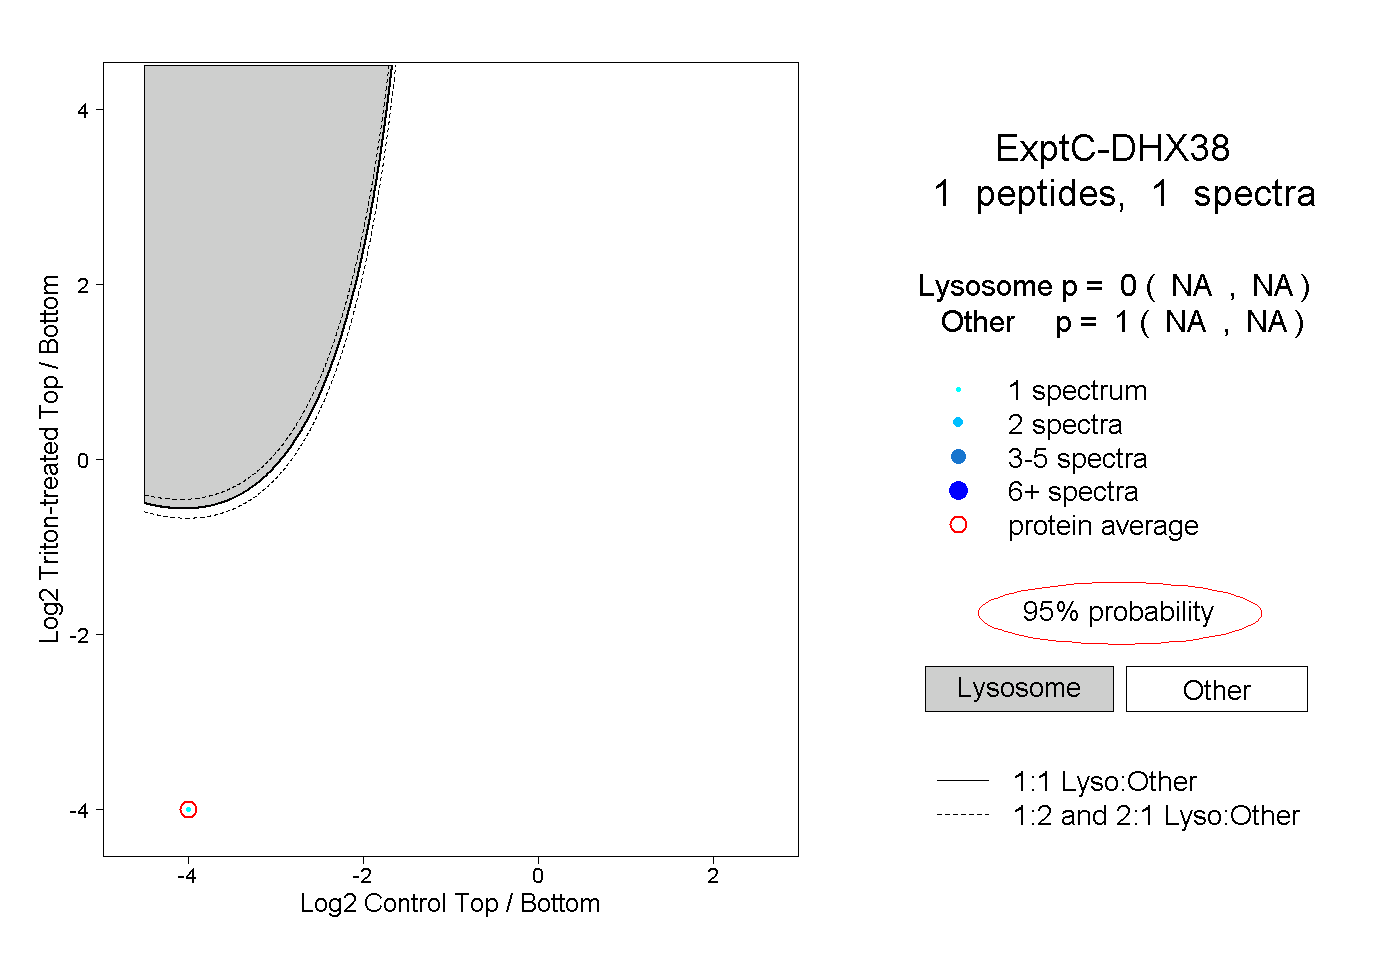
| Plot | Lyso | Other | |||||||||||
| Expt C |
1 peptide |
1 spectrum |
|
0.000 NA | NA |
1.000 NA | NA |