4
4peptides
spectra
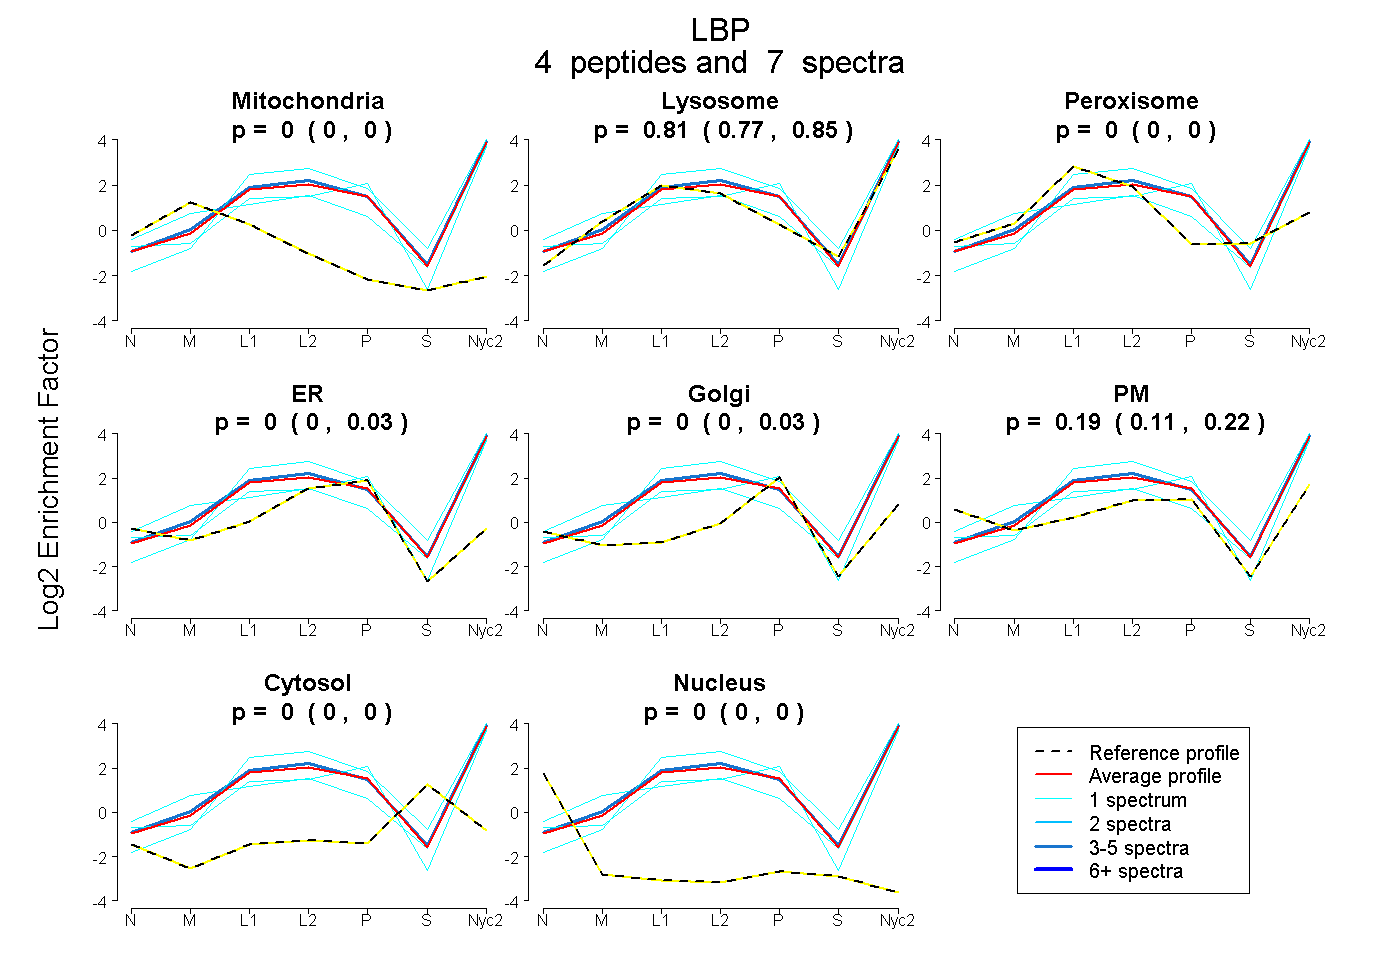
0.000 | 0.000
0.770 | 0.847
0.000 | 0.000
0.000 | 0.032
0.000 | 0.035
0.106 | 0.220
0.000 | 0.000
0.000 | 0.000
3peptides
spectra
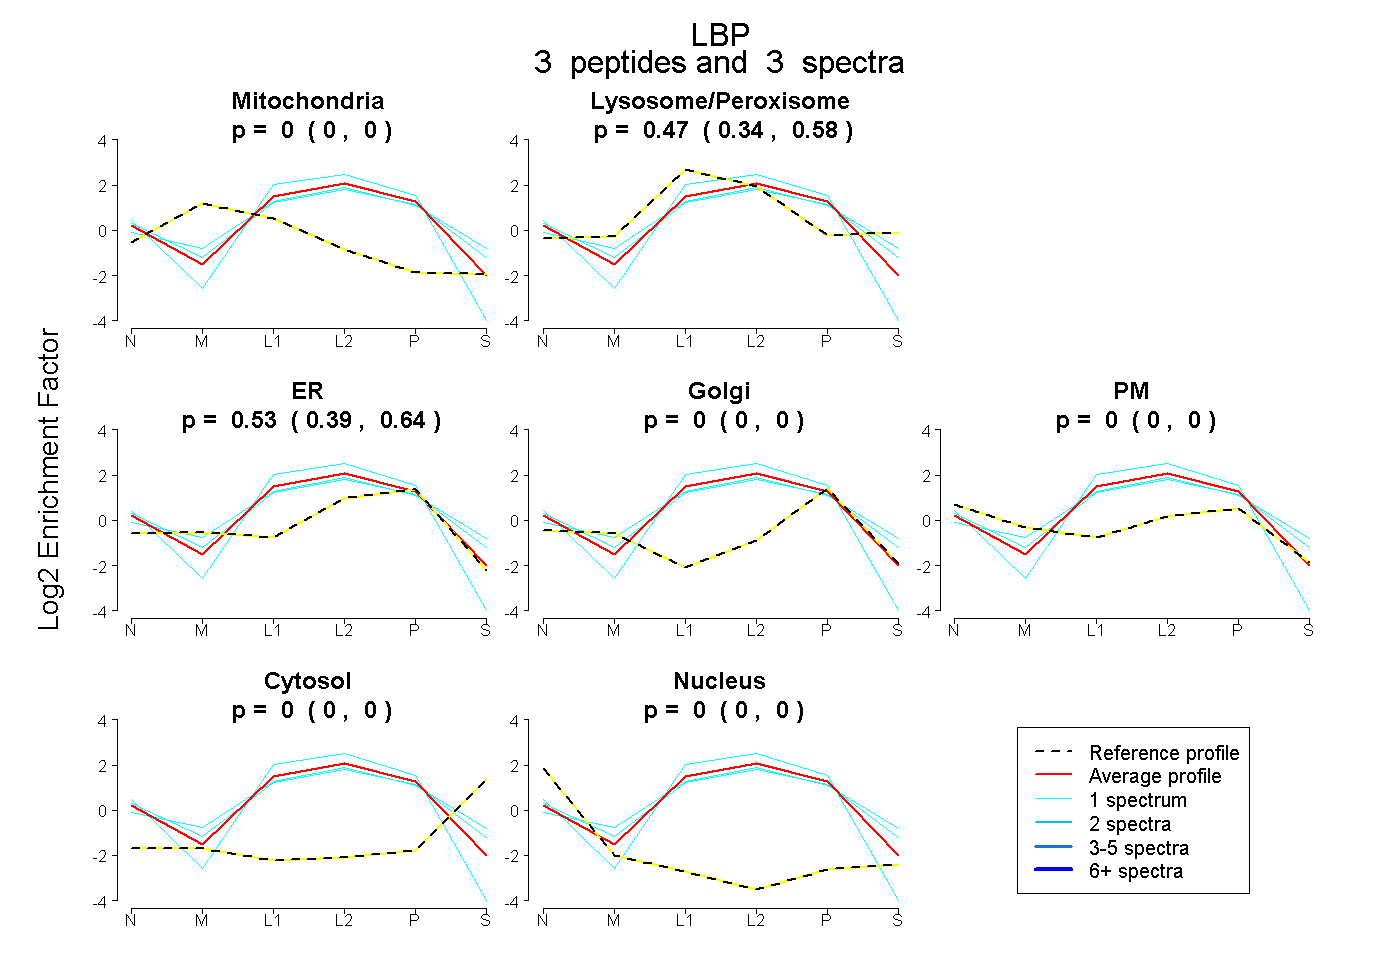
0.000 | 0.000
0.339 | 0.581
0.390 | 0.637
0.000 | 0.000
0.000 | 0.000
0.000 | 0.000
0.000 | 0.000
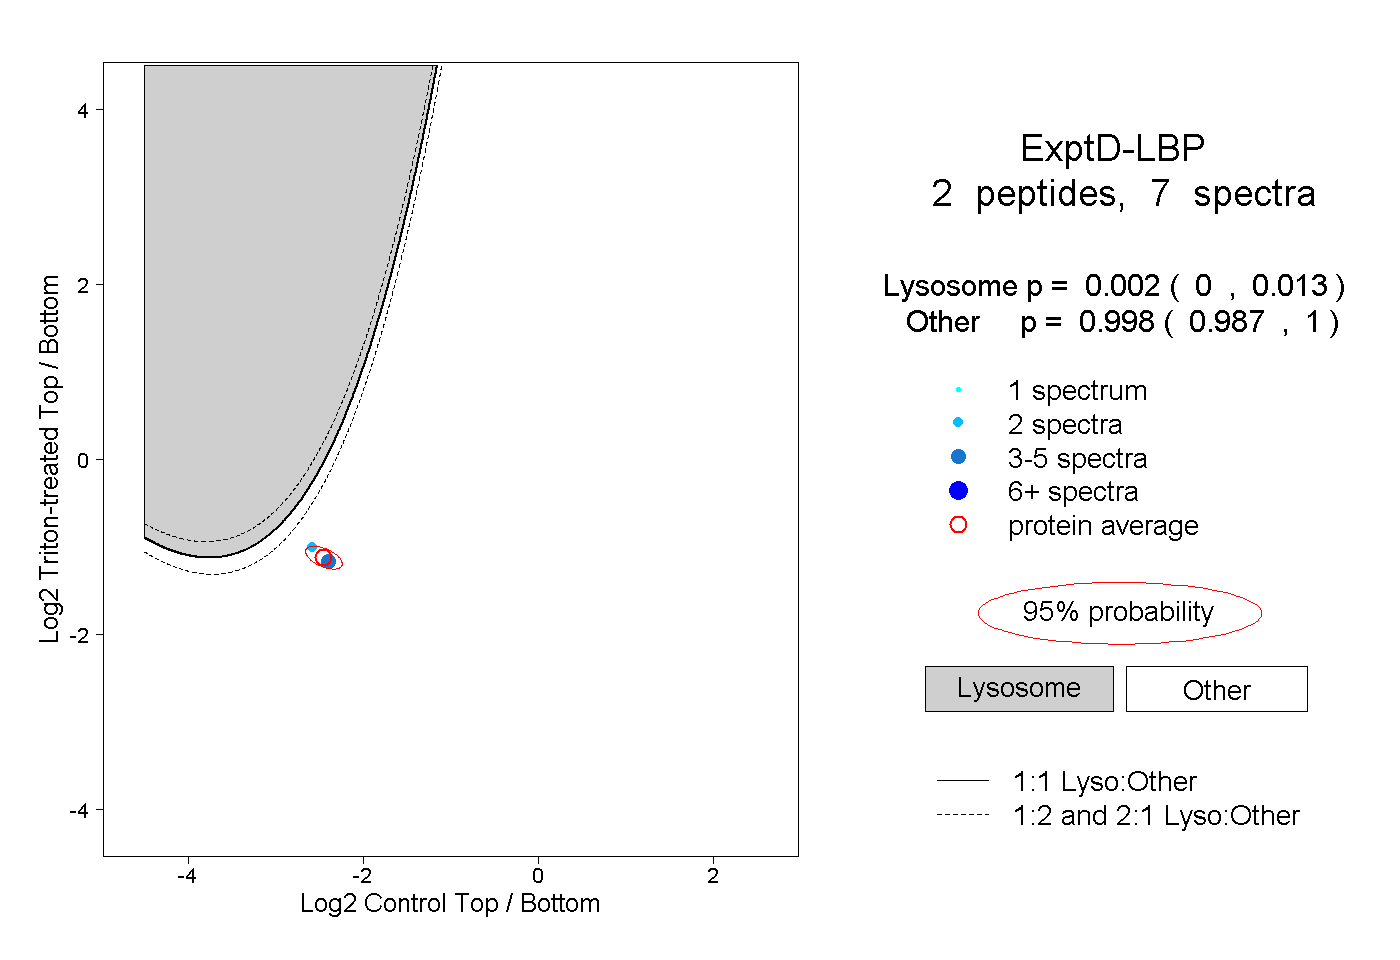
12peptides
spectra
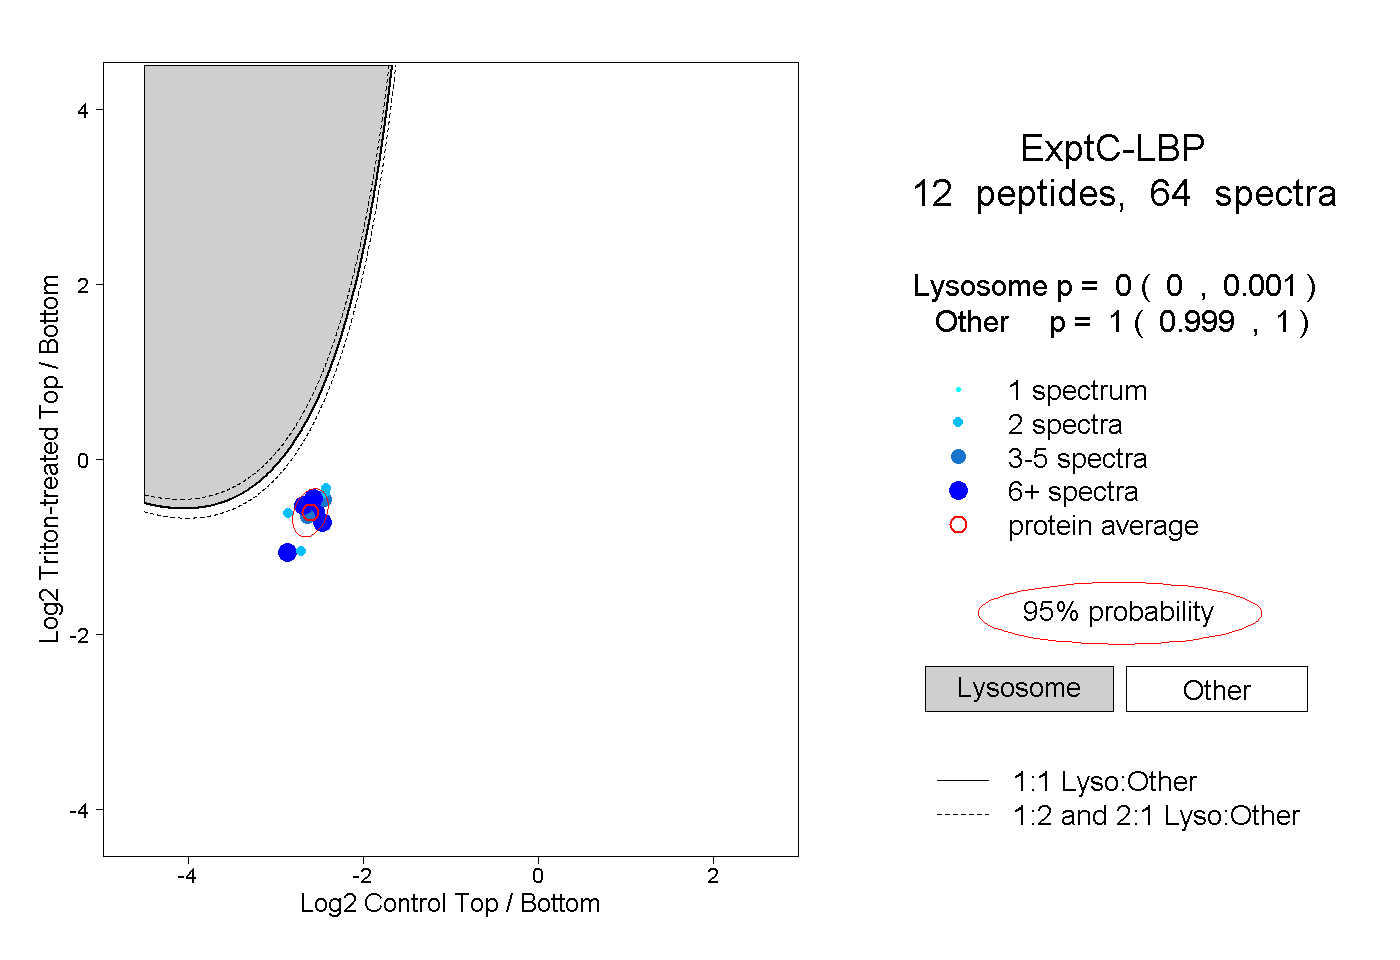
0.000 | 0.001
0.999 | 1.000