| 4 spectra, FVHGVR |
0.065 |
|
0.131 |
|
0.000 |
0.000 |
0.661 |
0.000 |
0.143 |
|
| 1 spectrum, TFYQIGDSWEK |
0.000 |
|
0.028 |
|
0.000 |
0.000 |
0.694 |
0.042 |
0.236 |
|
| 2 spectra, NTFAEVTGLSPGVTYLFK |
0.000 |
|
0.084 |
|
0.000 |
0.000 |
0.904 |
0.012 |
0.000 |
|
| 2 spectra, EYLGAICSCTCFGGQR |
0.048 |
|
0.443 |
|
0.000 |
0.000 |
0.279 |
0.169 |
0.062 |
|
| 3 spectra, VFAVHQGR |
0.072 |
|
0.313 |
|
0.000 |
0.000 |
0.488 |
0.000 |
0.127 |
|
| 4 spectra, VDVLPVNLPGEHGQR |
0.000 |
|
0.287 |
|
0.000 |
0.000 |
0.652 |
0.000 |
0.061 |
|
| 5 spectra, APITGYIIR |
0.000 |
|
0.491 |
|
0.000 |
0.000 |
0.381 |
0.000 |
0.128 |
|
| 2 spectra, STTPDITGYR |
0.080 |
|
0.000 |
|
0.000 |
0.000 |
0.787 |
0.000 |
0.133 |
|
| 5 spectra, GVTYNIIVEALHNQR |
0.173 |
|
0.054 |
|
0.000 |
0.000 |
0.604 |
0.055 |
0.113 |
|
| 3 spectra, SEPLIGR |
0.000 |
|
0.262 |
|
0.000 |
0.000 |
0.522 |
0.000 |
0.217 |
|
| 1 spectrum, VTDATETTITISWR |
0.086 |
|
0.275 |
|
0.000 |
0.000 |
0.133 |
0.285 |
0.220 |
|
| 6 spectra, LTVGLTR |
0.000 |
|
0.483 |
|
0.000 |
0.000 |
0.412 |
0.000 |
0.104 |
|
| 2 spectra, ITGYIIK |
0.108 |
|
0.171 |
|
0.000 |
0.000 |
0.542 |
0.000 |
0.179 |
|
| 1 spectrum, TISPDVR |
0.021 |
|
0.157 |
|
0.000 |
0.000 |
0.573 |
0.000 |
0.249 |
|
| 1 spectrum, DLQFVEVTDVK |
0.097 |
|
0.054 |
|
0.000 |
0.000 |
0.687 |
0.000 |
0.162 |
|
| 1 spectrum, ATGVFTTLQPLR |
0.041 |
|
0.000 |
|
0.000 |
0.000 |
0.726 |
0.000 |
0.233 |
|
| 9 spectra, LGVRPSQGGEAPR |
0.084 |
|
0.096 |
|
0.000 |
0.000 |
0.653 |
0.041 |
0.124 |
|
| 6 spectra, DAPIVNR |
0.058 |
|
0.011 |
|
0.000 |
0.000 |
0.725 |
0.000 |
0.206 |
|
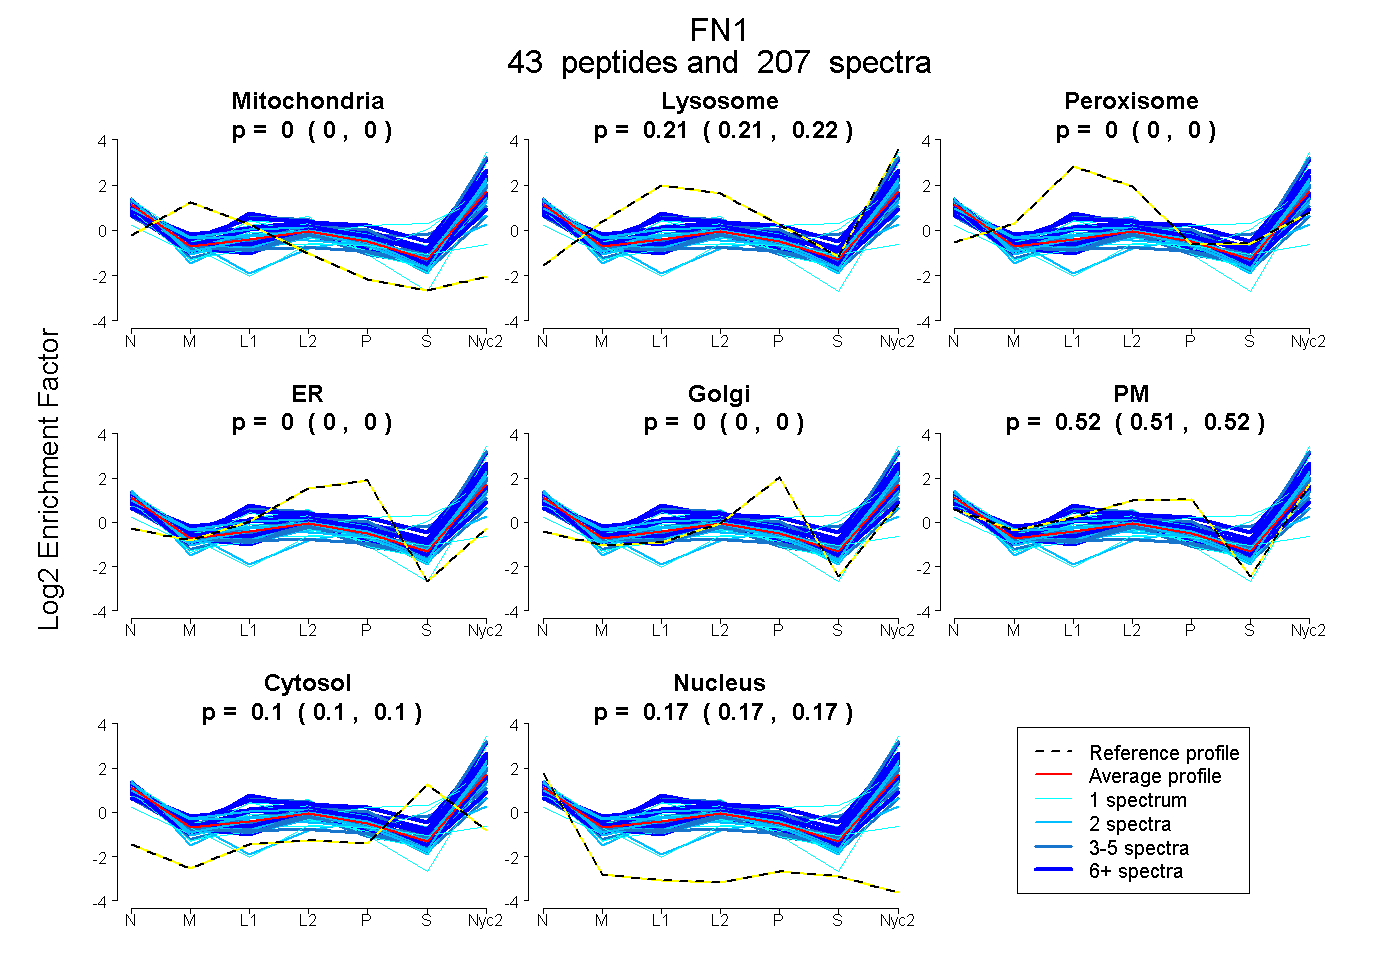
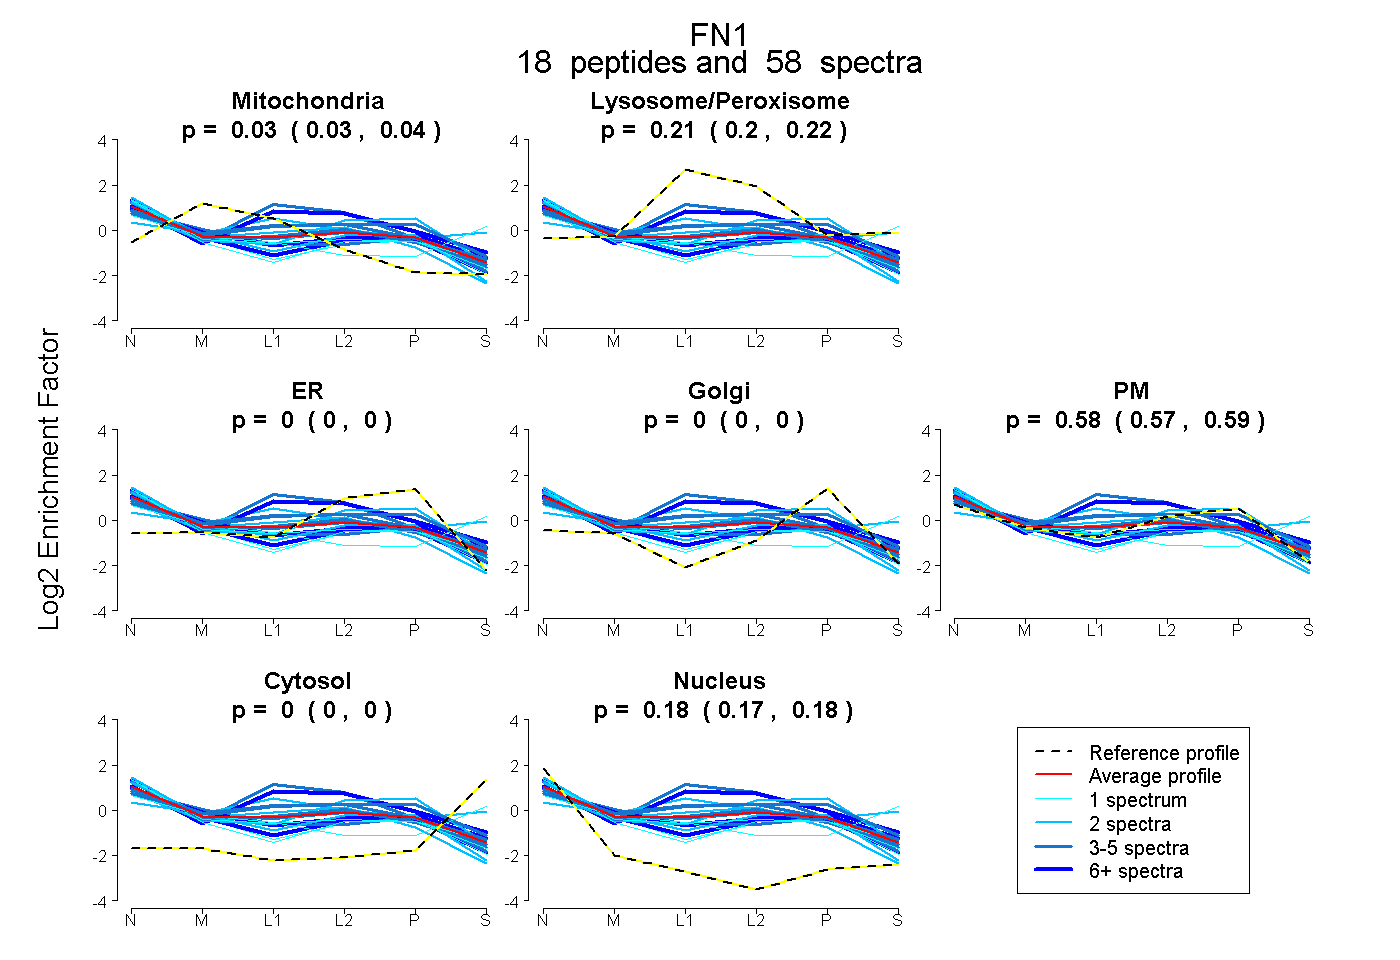
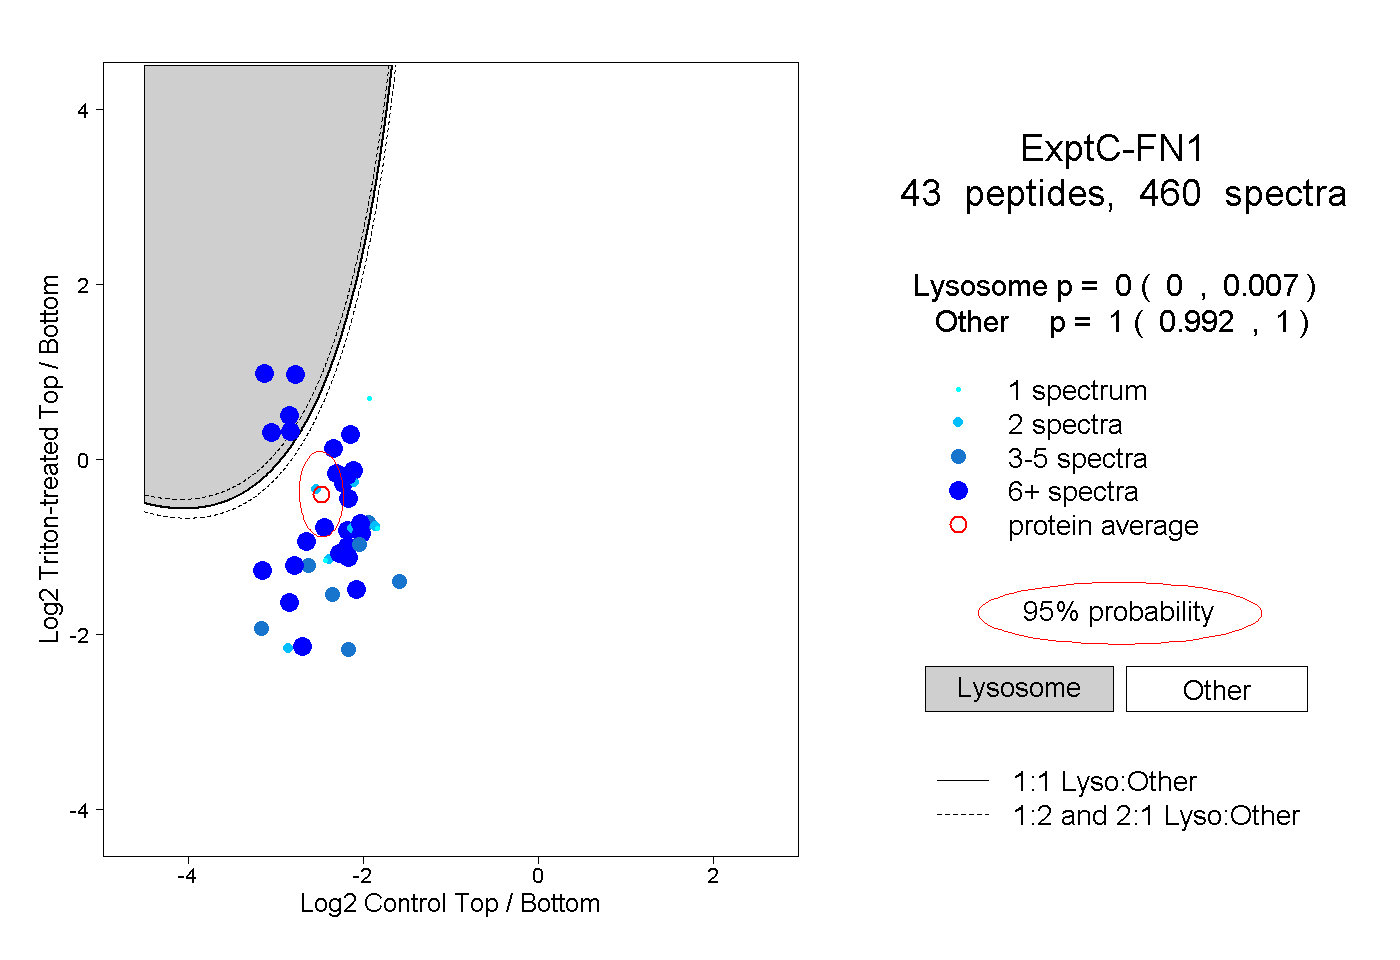
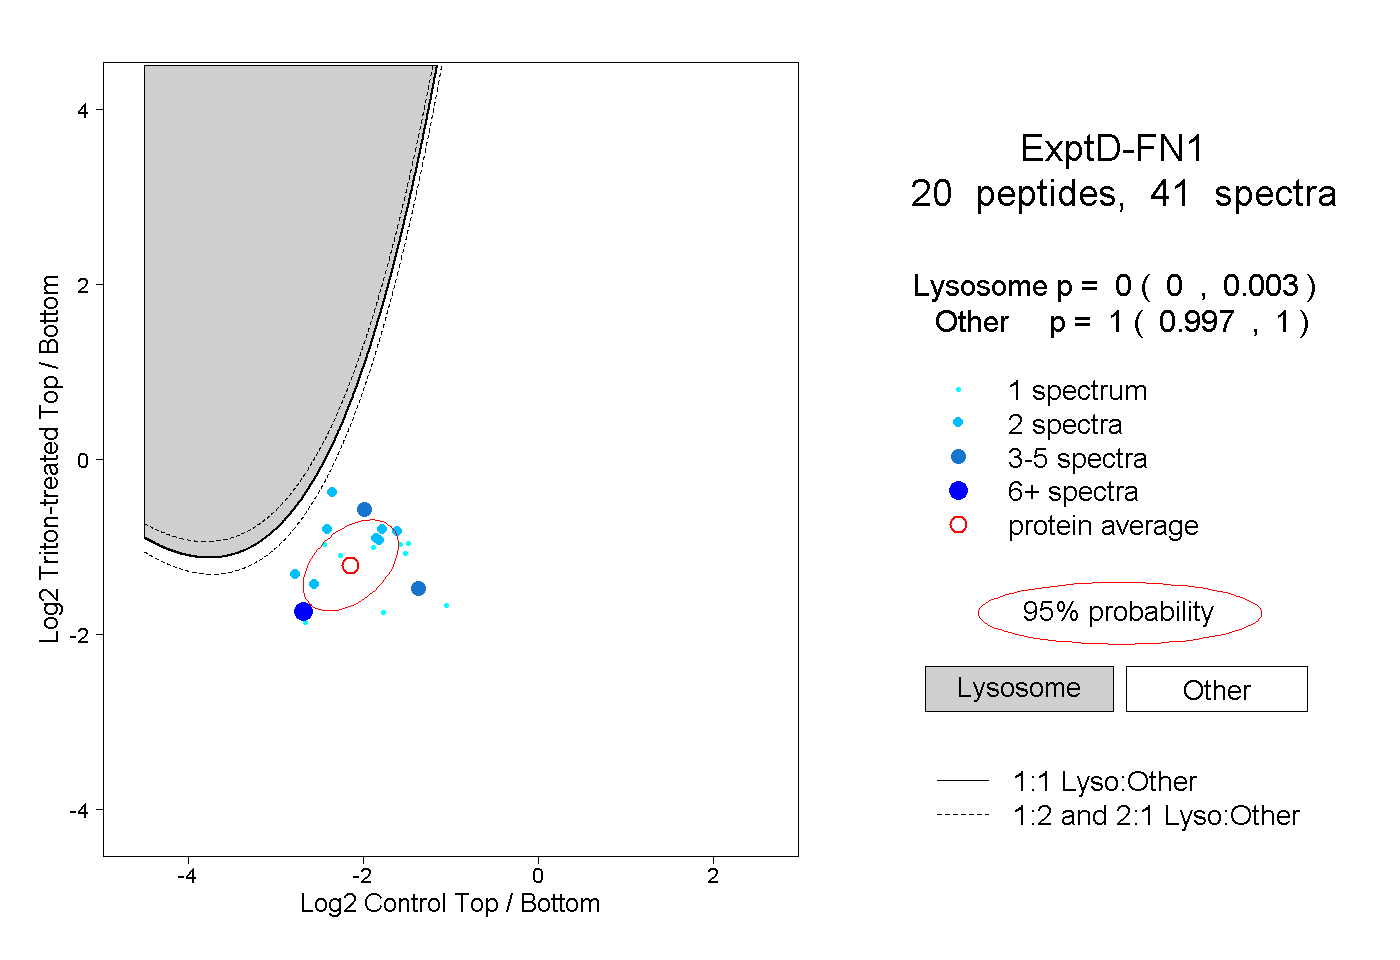
 43
43