11
11peptides
spectra
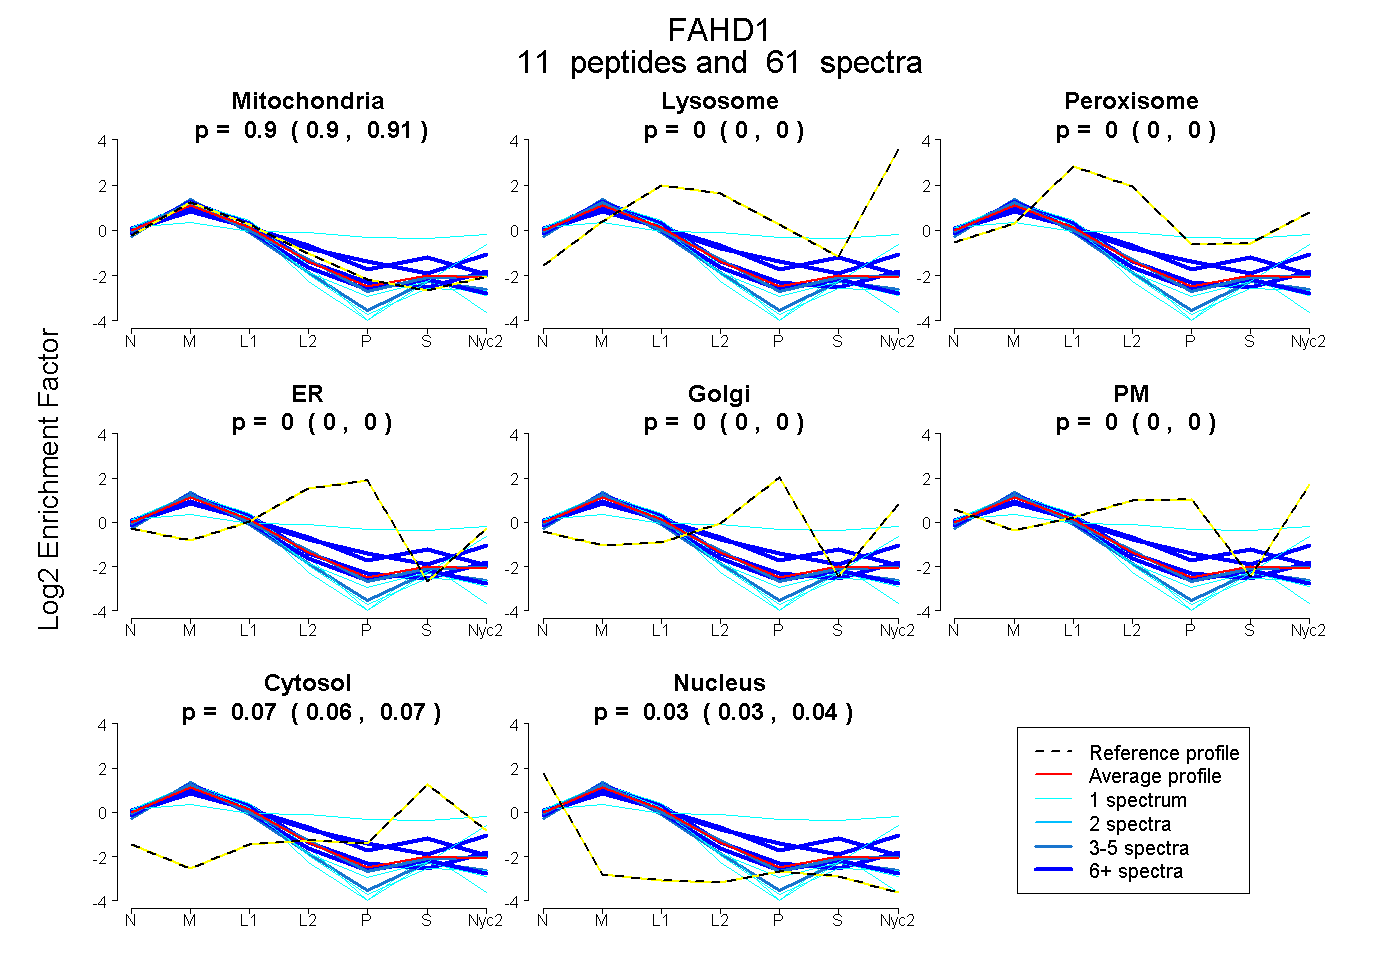
0.898 | 0.907
0.000 | 0.000
0.000 | 0.000
0.000 | 0.000
0.000 | 0.000
0.000 | 0.000
0.058 | 0.072
0.025 | 0.037
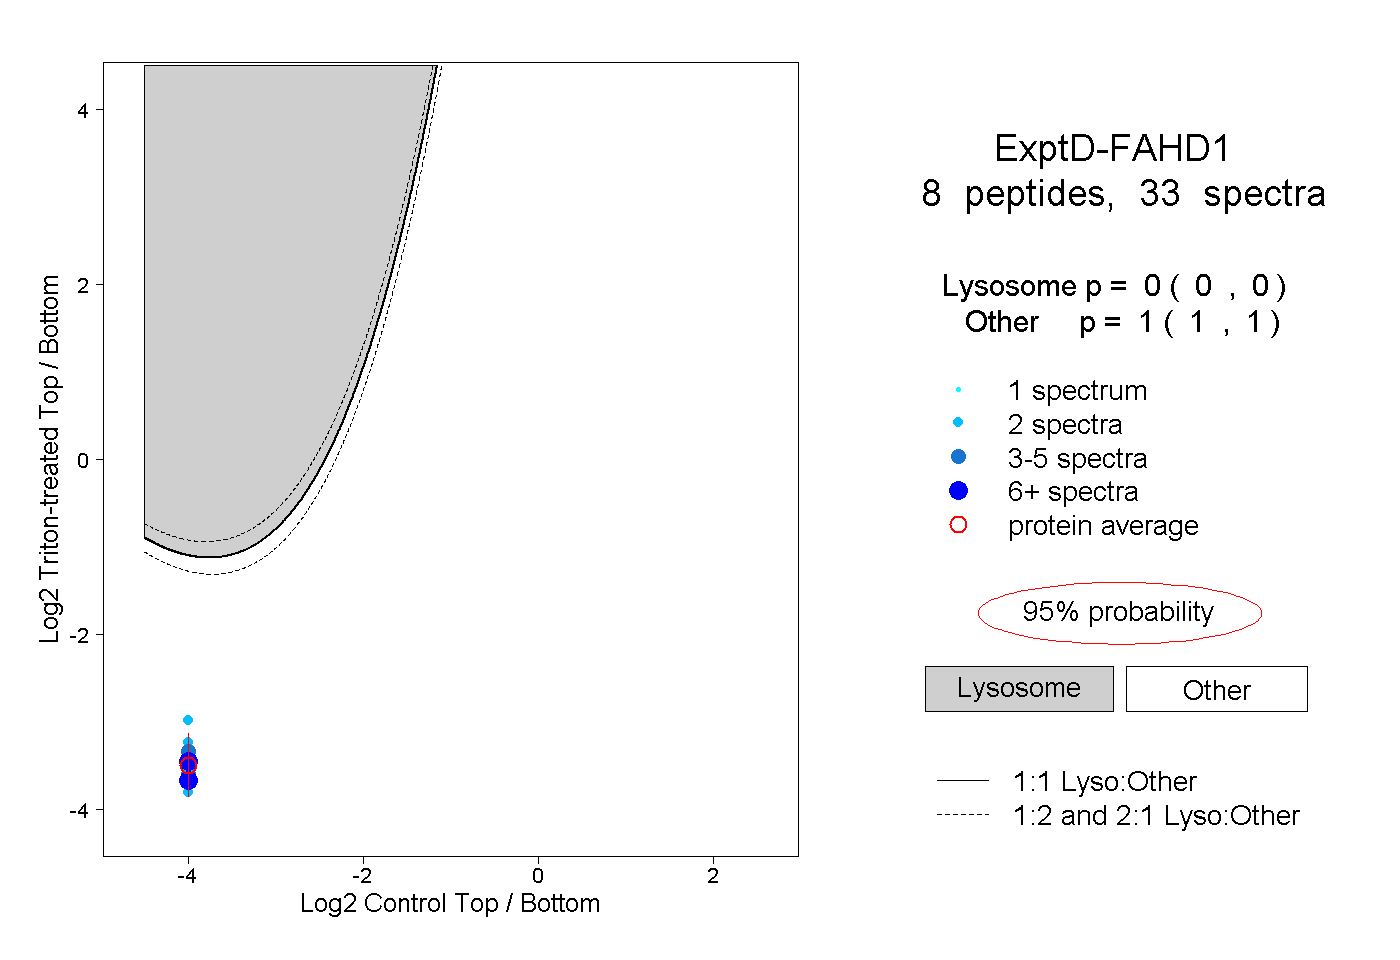
8peptides
spectra
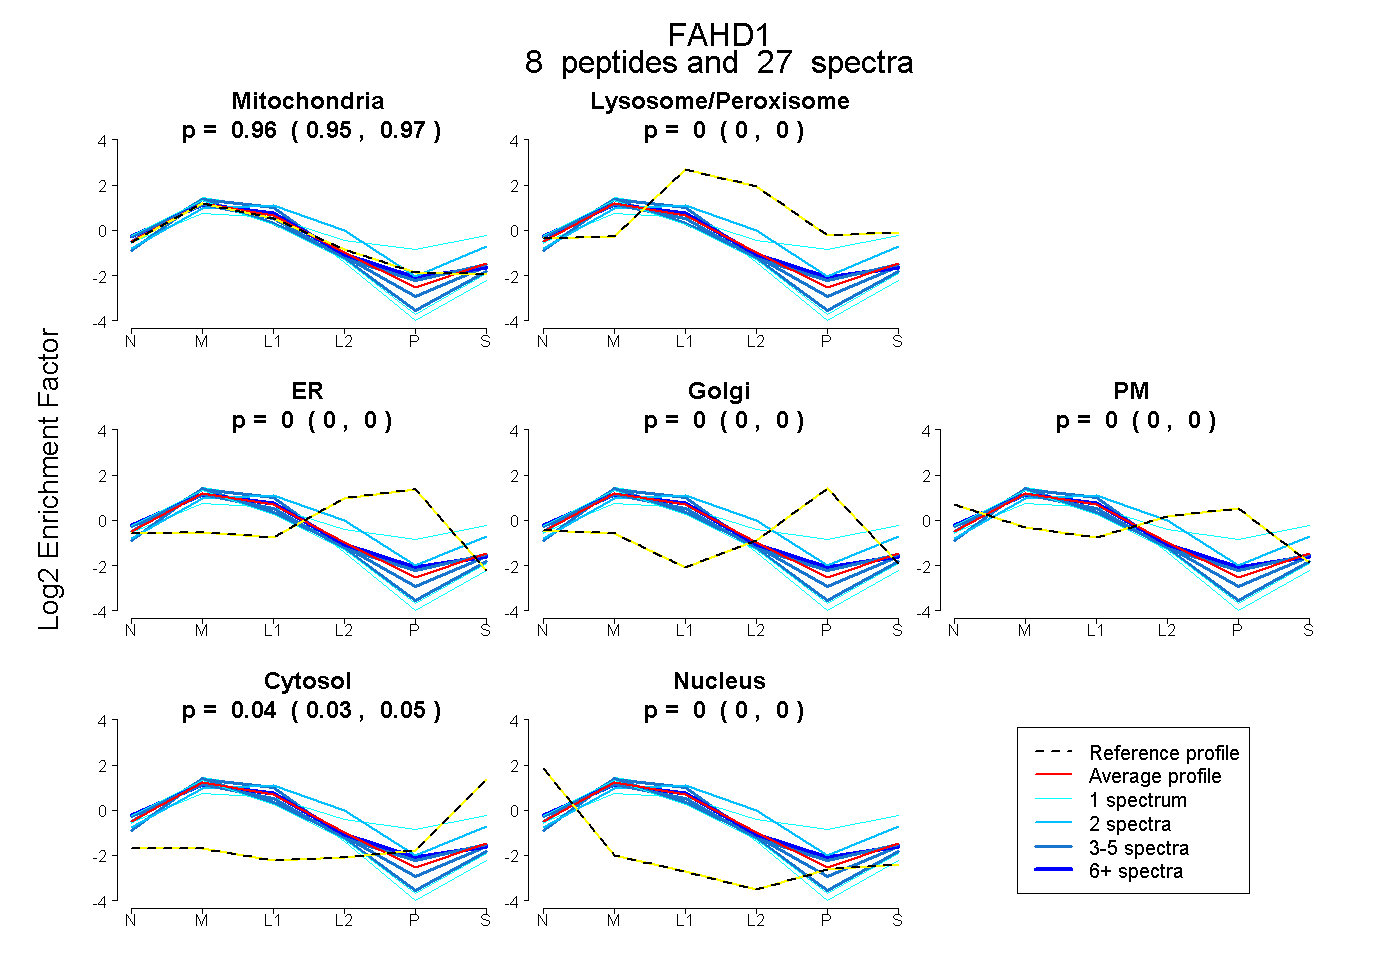
0.947 | 0.966
0.000 | 0.000
0.000 | 0.000
0.000 | 0.000
0.000 | 0.000
0.032 | 0.051
0.000 | 0.000
11peptides
spectra
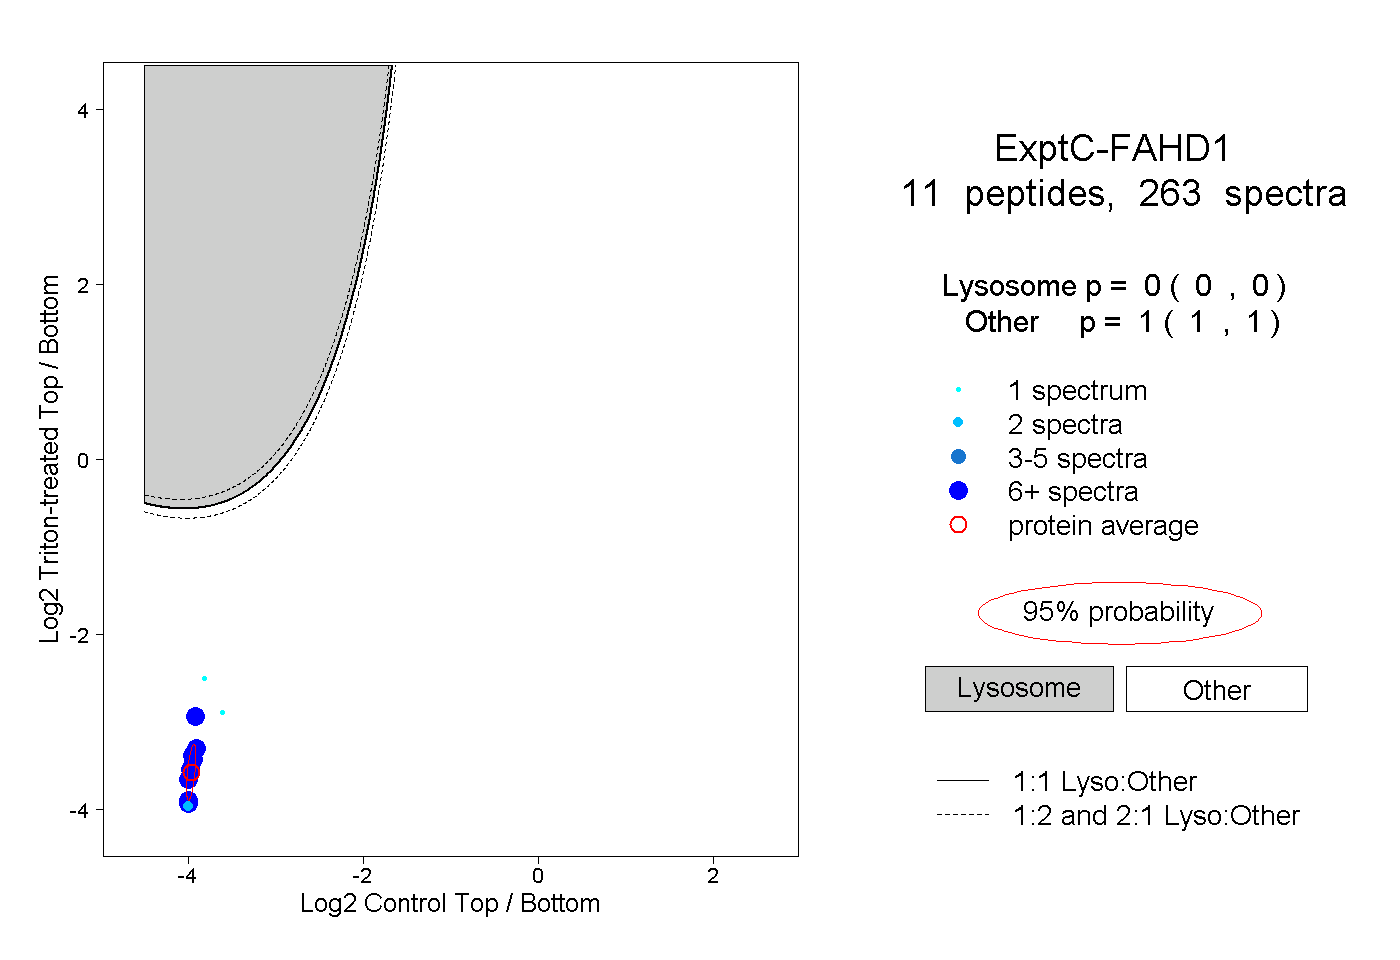
0.000 | 0.000
1.000 | 1.000