 11
11peptides
spectra
0.898 | 0.907
0.000 | 0.000
0.000 | 0.000
0.000 | 0.000
0.000 | 0.000
0.000 | 0.000
0.058 | 0.072
0.025 | 0.037
| Plot | Mito | Lyso | Perox | ER | Golgi | PM | Cytosol | Nucleus | |||||
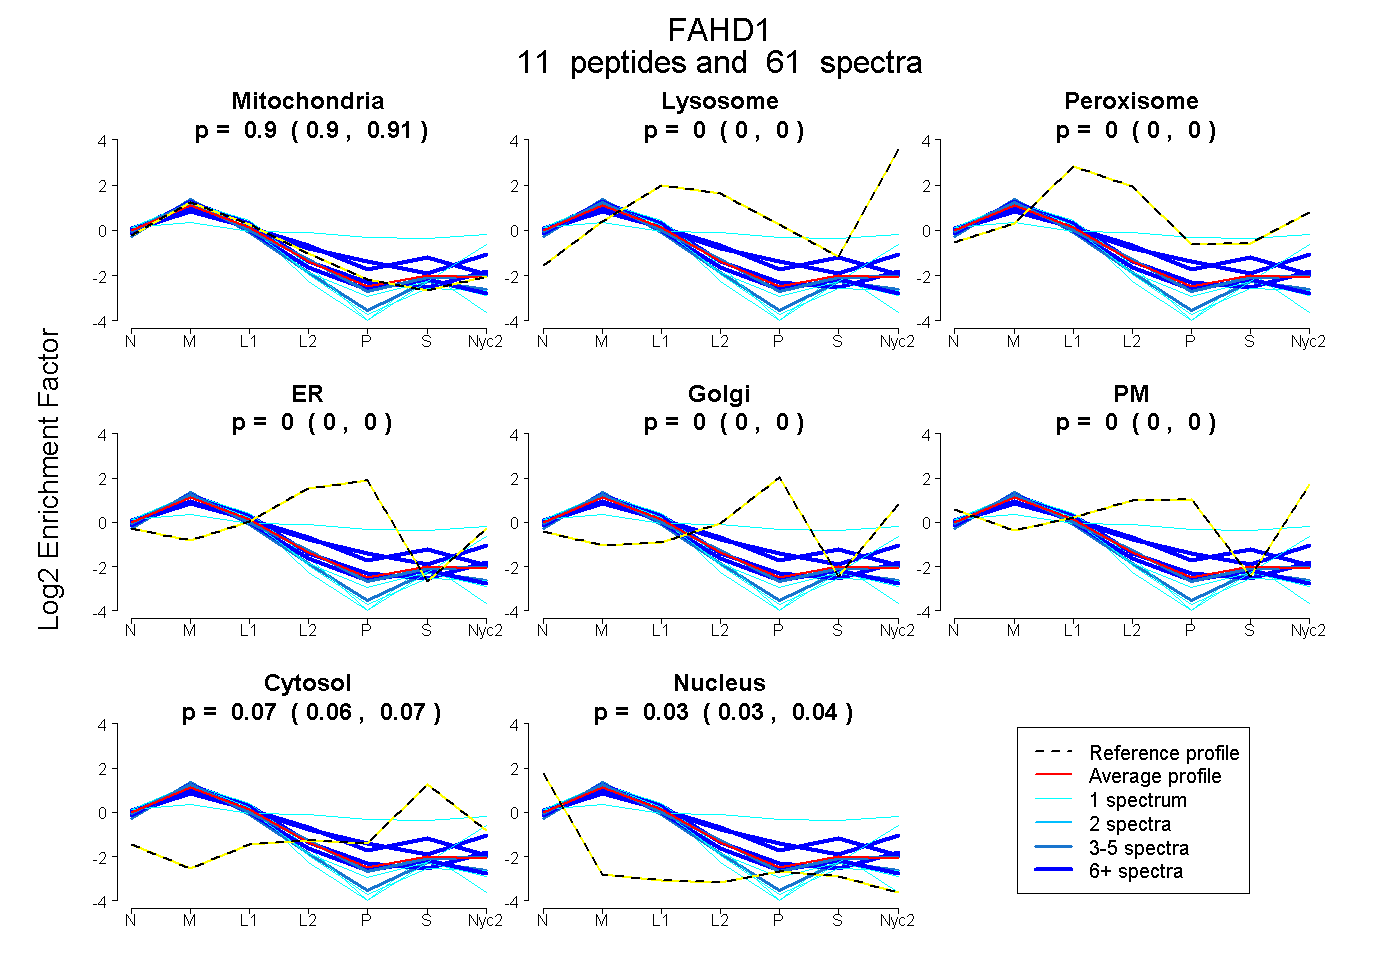
| Expt A |
11 peptides |
61 spectra |
|
0.903 0.898 | 0.907 |
0.000 0.000 | 0.000 |
0.000 0.000 | 0.000 |
0.000 0.000 | 0.000 |
0.000 0.000 | 0.000 |
0.000 0.000 | 0.000 |
0.065 0.058 | 0.072 |
0.032 0.025 | 0.037 |
| 4 spectra, FWEWGK | 0.899 | 0.000 | 0.000 | 0.000 | 0.000 | 0.000 | 0.000 | 0.101 | ||
| 7 spectra, ENDEIEAGIDGVVSMR | 0.727 | 0.000 | 0.096 | 0.000 | 0.000 | 0.000 | 0.178 | 0.000 | ||
| 3 spectra, VNGELR | 0.923 | 0.000 | 0.000 | 0.000 | 0.000 | 0.000 | 0.045 | 0.032 | ||
| 26 spectra, NIVCVGR | 0.907 | 0.000 | 0.000 | 0.000 | 0.000 | 0.000 | 0.000 | 0.093 | ||
| 1 spectrum, IITLEEGDLILTGTPK | 0.909 | 0.000 | 0.000 | 0.000 | 0.000 | 0.000 | 0.000 | 0.091 | ||
| 1 spectrum, DVQDECK | 0.837 | 0.000 | 0.000 | 0.000 | 0.000 | 0.000 | 0.000 | 0.163 | ||
| 7 spectra, IPDPHALR | 0.705 | 0.008 | 0.018 | 0.000 | 0.000 | 0.184 | 0.085 | 0.000 | ||
| 9 spectra, GLPWTLAK | 0.956 | 0.013 | 0.000 | 0.000 | 0.000 | 0.000 | 0.000 | 0.030 | ||
| 1 spectrum, SFTSSCPVSAFVPK | 0.804 | 0.107 | 0.000 | 0.000 | 0.000 | 0.000 | 0.000 | 0.089 | ||
| 1 spectrum, GVGAVK | 0.883 | 0.000 | 0.000 | 0.000 | 0.000 | 0.000 | 0.000 | 0.117 | ||
| 1 spectrum, NLHHEVELGVLLGR | 0.247 | 0.000 | 0.177 | 0.000 | 0.000 | 0.296 | 0.280 | 0.000 |
| Plot | Mito | Lyso or Perox | ER | Golgi | PM | Cytosol | Nucleus | ||||||
| Expt B |
8 peptides |
27 spectra |
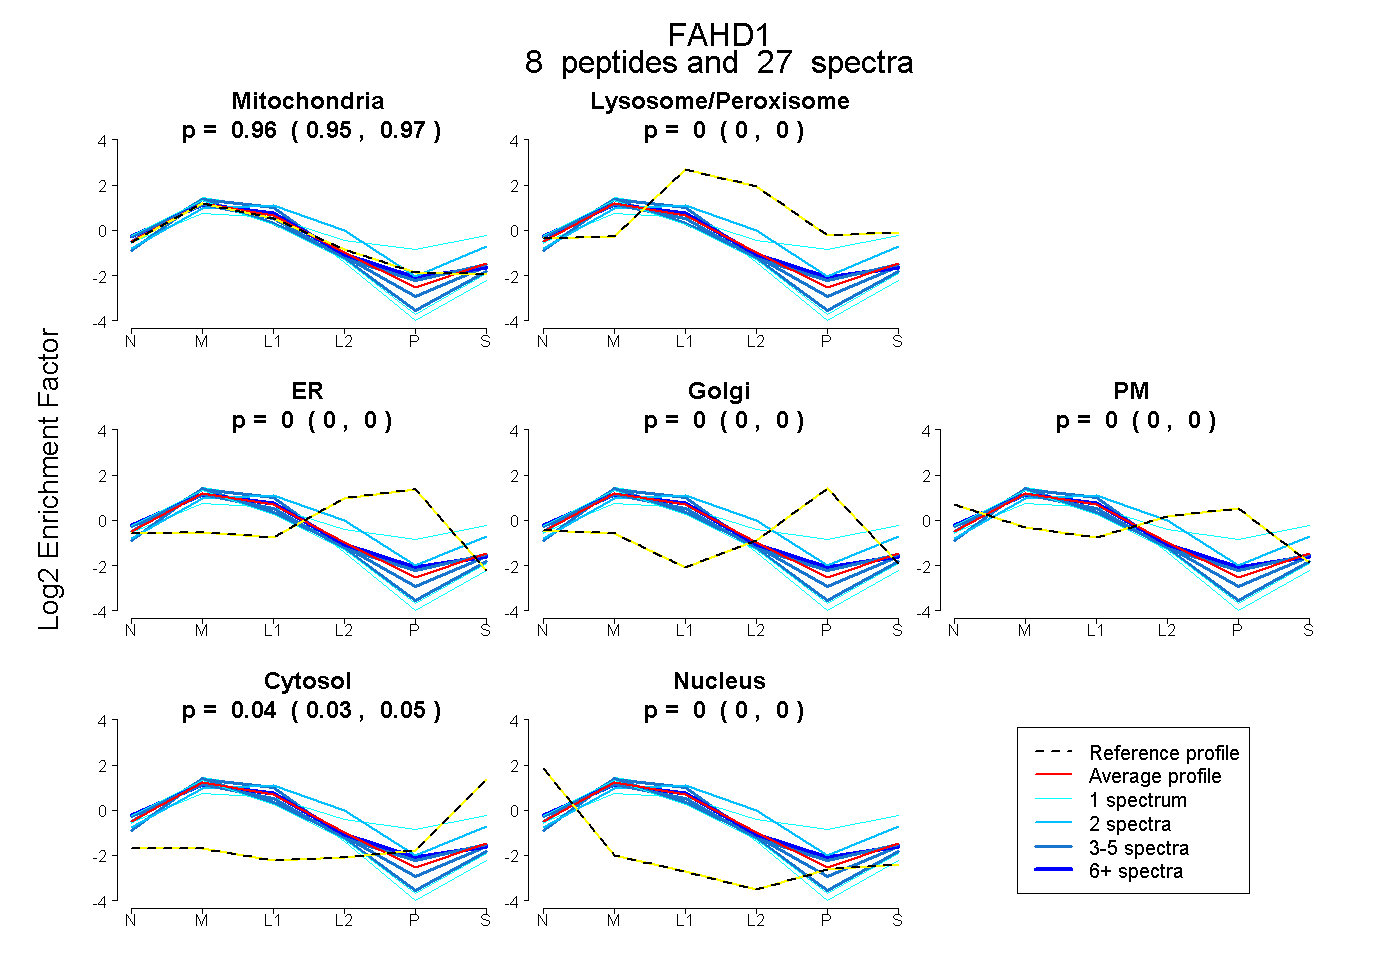 |
0.958 0.947 | 0.966 |
0.000 0.000 | 0.000 |
0.000 0.000 | 0.000 |
0.000 0.000 | 0.000 |
0.000 0.000 | 0.000 |
0.042 0.032 | 0.051 |
0.000 0.000 | 0.000 |
|||
| Plot | Lyso | Other | |||||||||||
| Expt C |
11 peptides |
263 spectra |
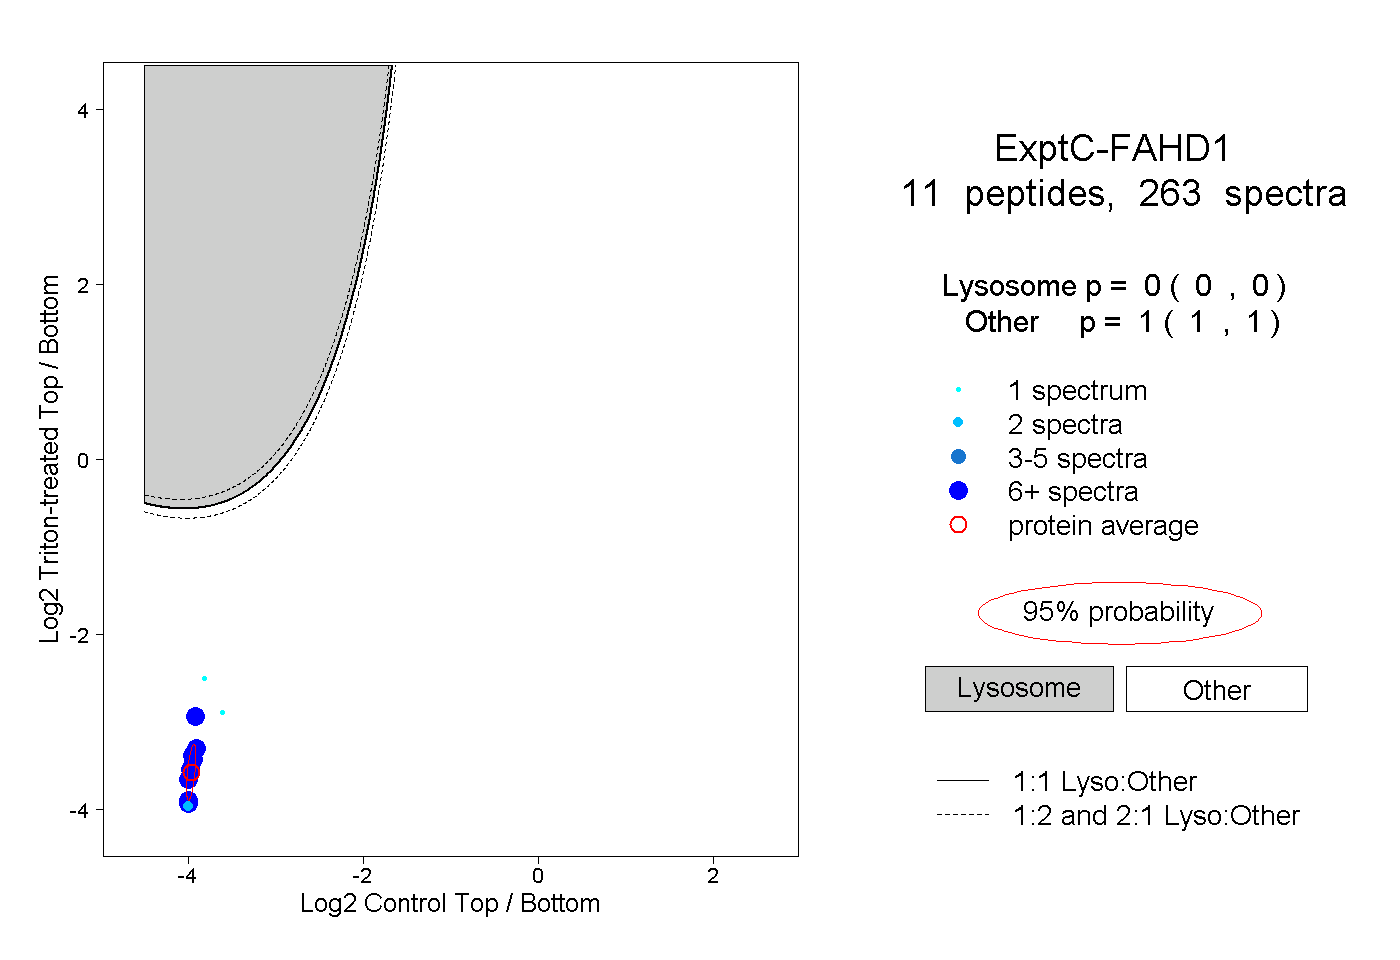 |
0.000 0.000 | 0.000 |
1.000 1.000 | 1.000 |
||||||||
| Plot | Lyso | Other | |||||||||||
| Expt D |
8 peptides |
33 spectra |
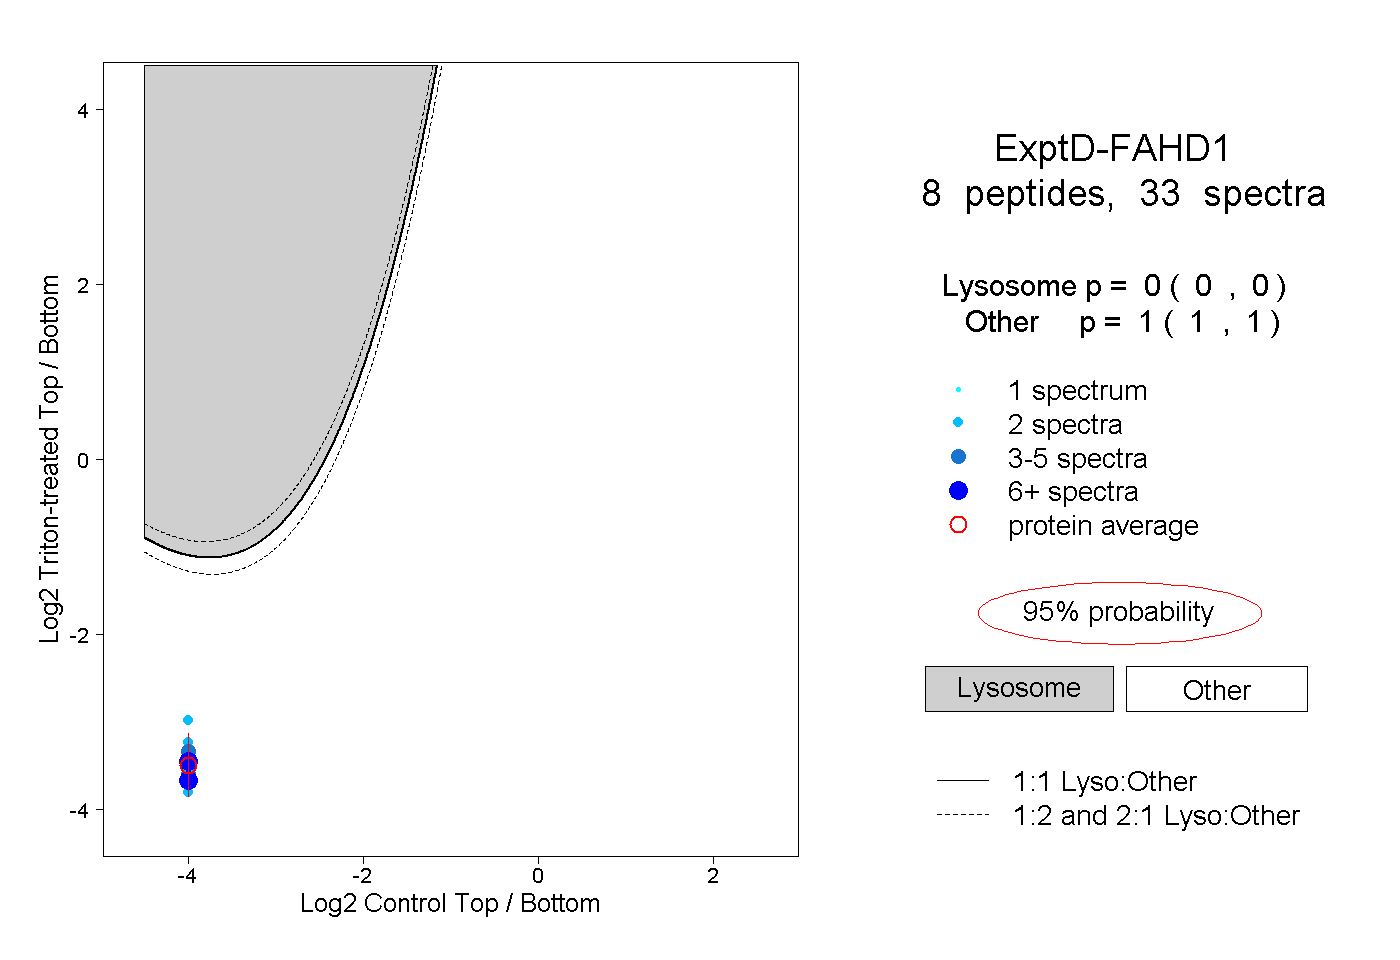 |
0.000 0.000 | 0.000 |
1.000 1.000 | 1.000 |