 6
6peptides
spectra
0.000 | 0.000
0.133 | 0.189
0.000 | 0.000
0.000 | 0.108
0.598 | 0.708
0.031 | 0.133
0.002 | 0.059
0.000 | 0.000
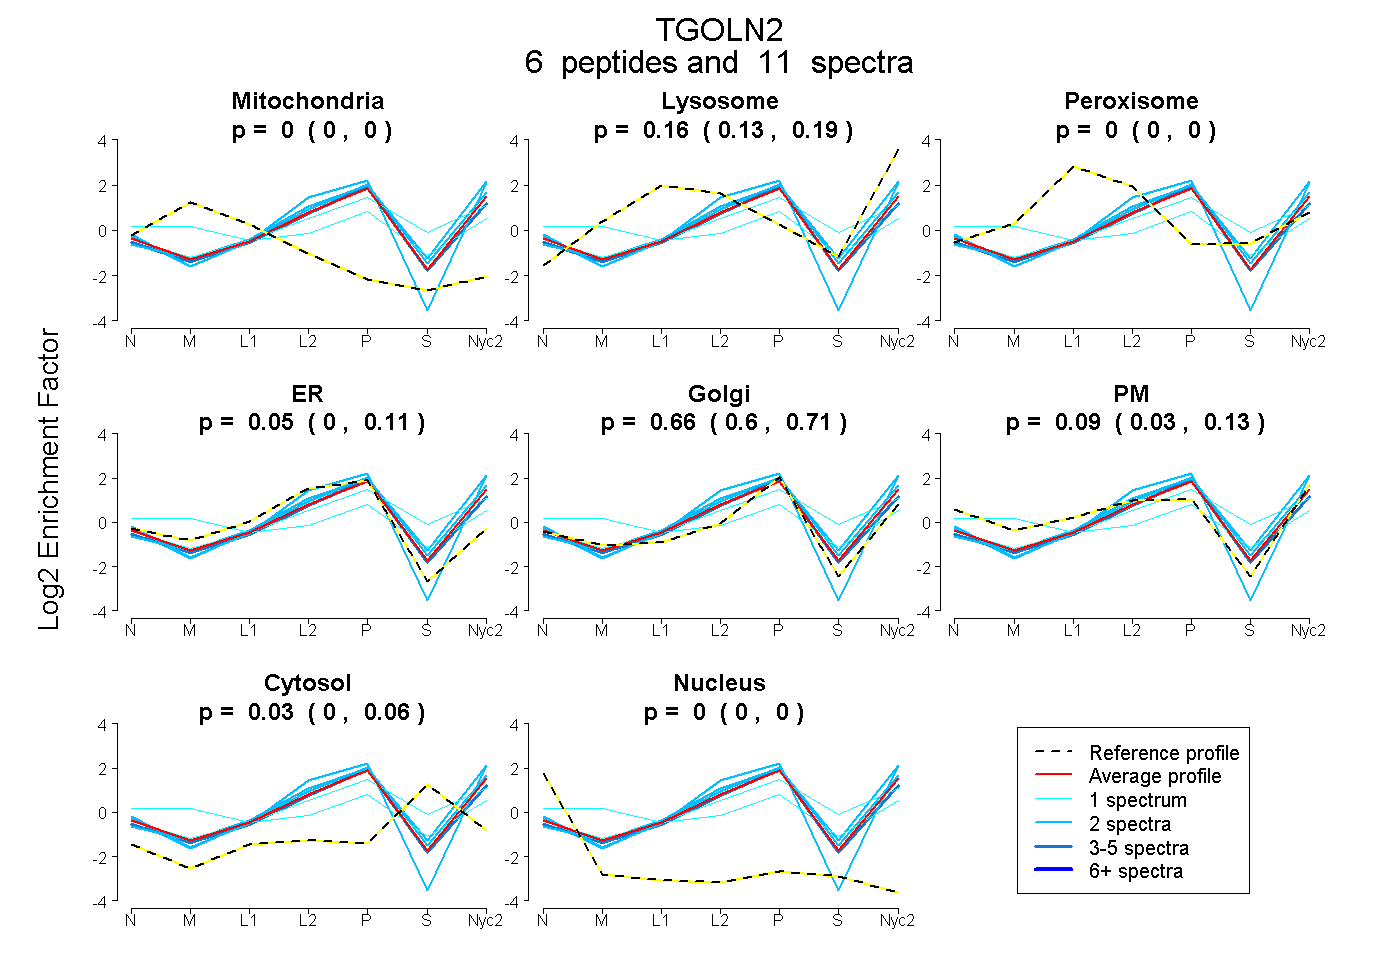
| Plot | Mito | Lyso | Perox | ER | Golgi | PM | Cytosol | Nucleus | |||||
| Expt A |
6 peptides |
11 spectra |
|
0.000 0.000 | 0.000 |
0.164 0.133 | 0.189 |
0.000 0.000 | 0.000 |
0.051 0.000 | 0.108 |
0.661 0.598 | 0.708 |
0.090 0.031 | 0.133 |
0.033 0.002 | 0.059 |
0.000 0.000 | 0.000 |
| 1 spectrum, VQLTEK | 0.000 | 0.216 | 0.000 | 0.079 | 0.387 | 0.042 | 0.276 | 0.000 | ||
| 3 spectra, IIAFALEGK | 0.000 | 0.136 | 0.000 | 0.153 | 0.666 | 0.000 | 0.045 | 0.000 | ||
| 2 spectra, HPETADAK | 0.000 | 0.166 | 0.000 | 0.024 | 0.667 | 0.103 | 0.040 | 0.000 | ||
| 2 spectra, TNRPTDQR | 0.000 | 0.000 | 0.000 | 0.099 | 0.410 | 0.491 | 0.000 | 0.000 | ||
| 1 spectrum, TSASVSSGVESATNLNLDDSK | 0.144 | 0.010 | 0.024 | 0.000 | 0.263 | 0.399 | 0.160 | 0.000 | ||
| 2 spectra, SSEPTEDVETK | 0.000 | 0.319 | 0.000 | 0.000 | 0.660 | 0.000 | 0.022 | 0.000 |
| Plot | Mito | Lyso or Perox | ER | Golgi | PM | Cytosol | Nucleus | ||||||
| Expt B |
1 peptide |
2 spectra |
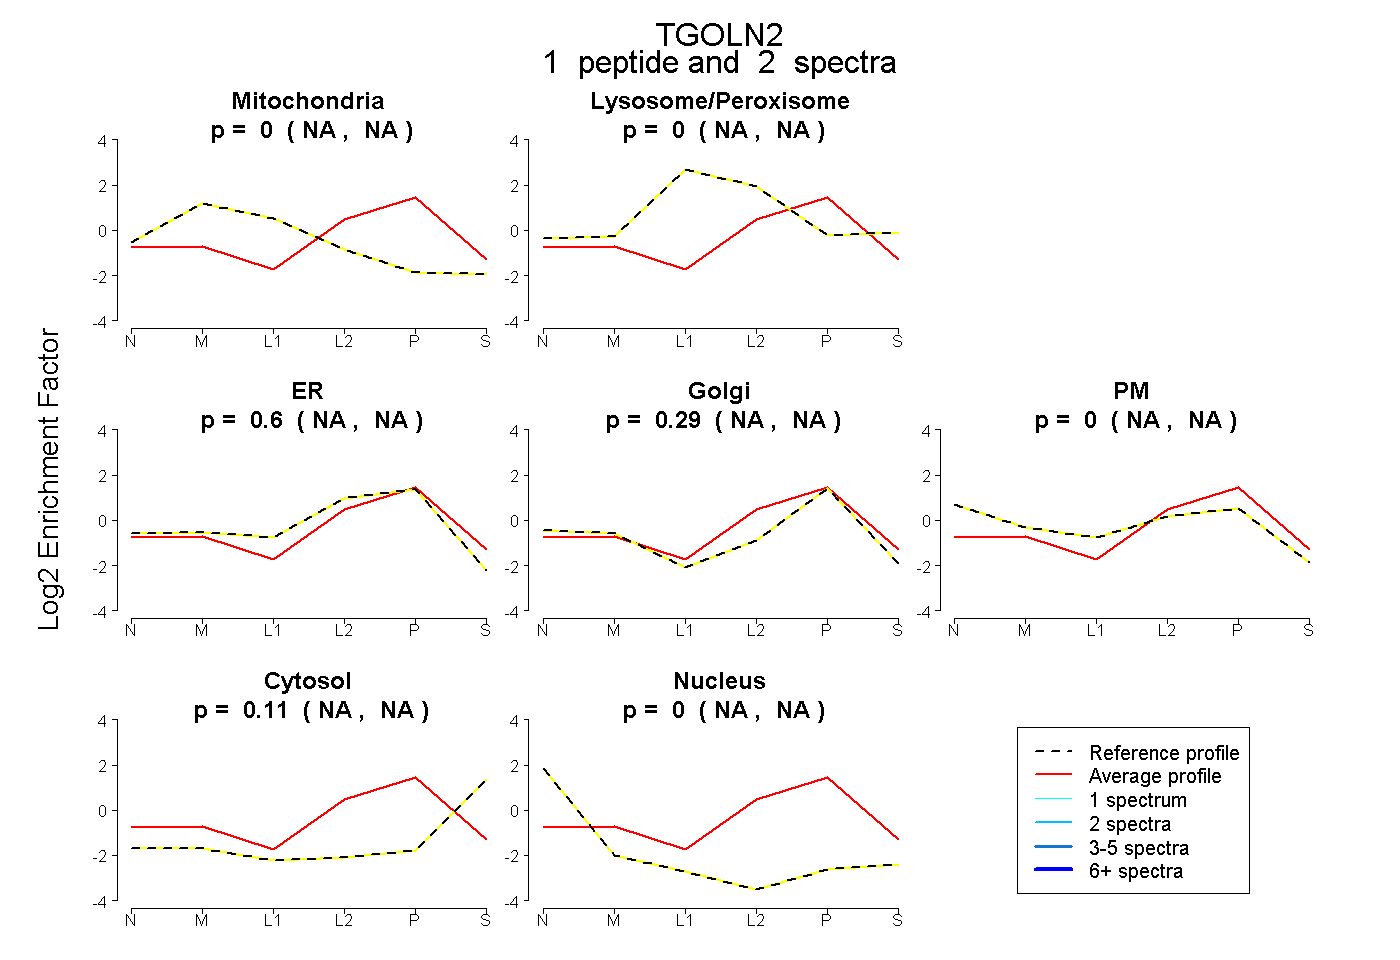 |
0.000 NA | NA |
0.000 NA | NA |
0.601 NA | NA |
0.290 NA | NA |
0.000 NA | NA |
0.108 NA | NA |
0.000 NA | NA |
|||
| Plot | Lyso | Other | |||||||||||
| Expt C |
9 peptides |
38 spectra |
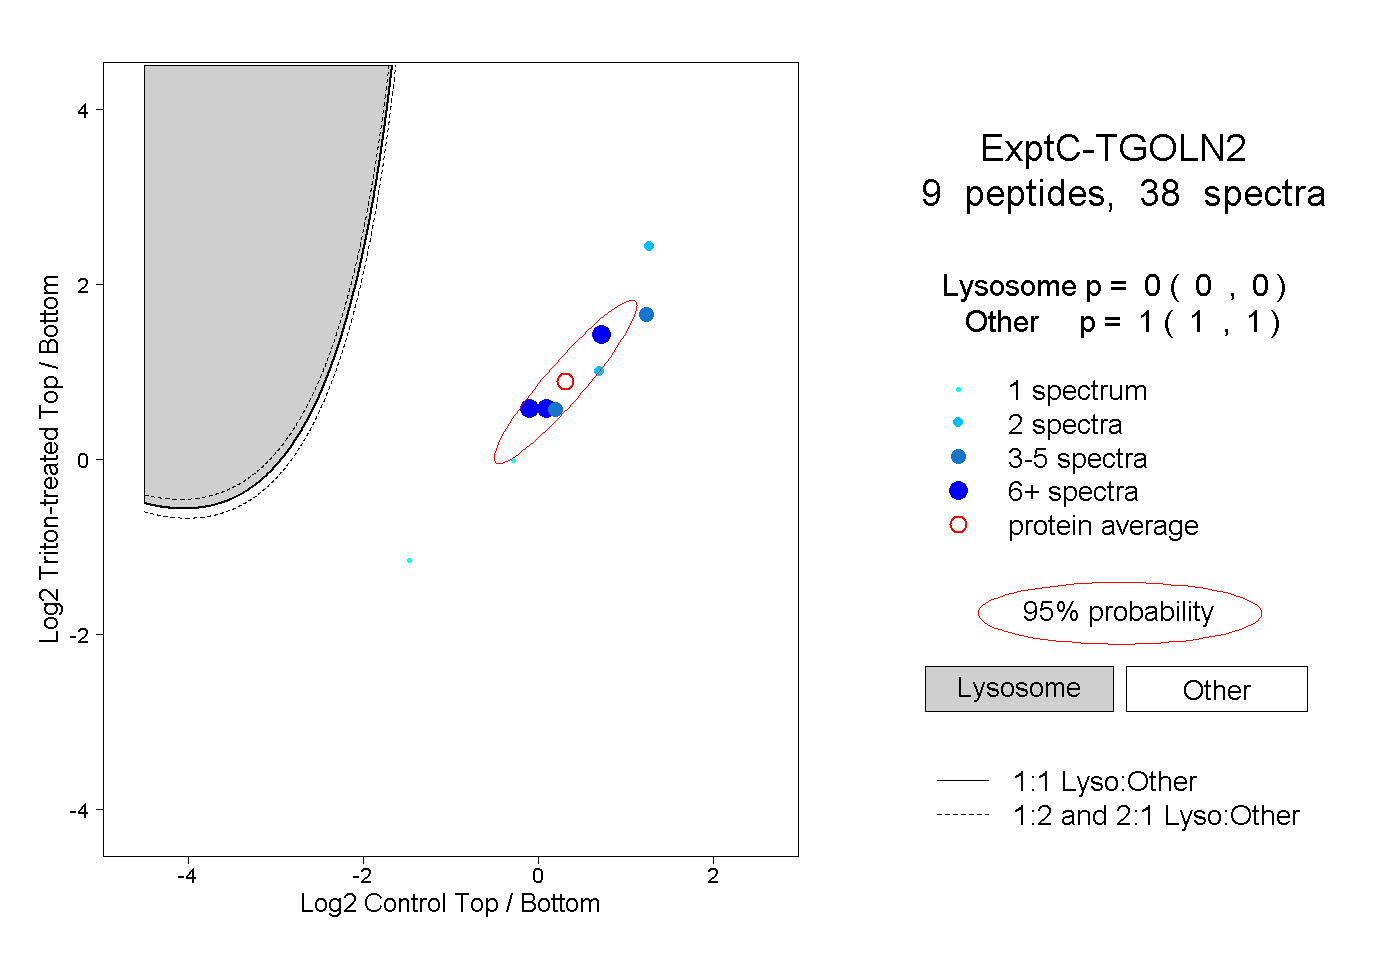 |
0.000 0.000 | 0.000 |
1.000 1.000 | 1.000 |
||||||||
| Plot | Lyso | Other | |||||||||||
| Expt D |
1 peptide |
1 spectrum |
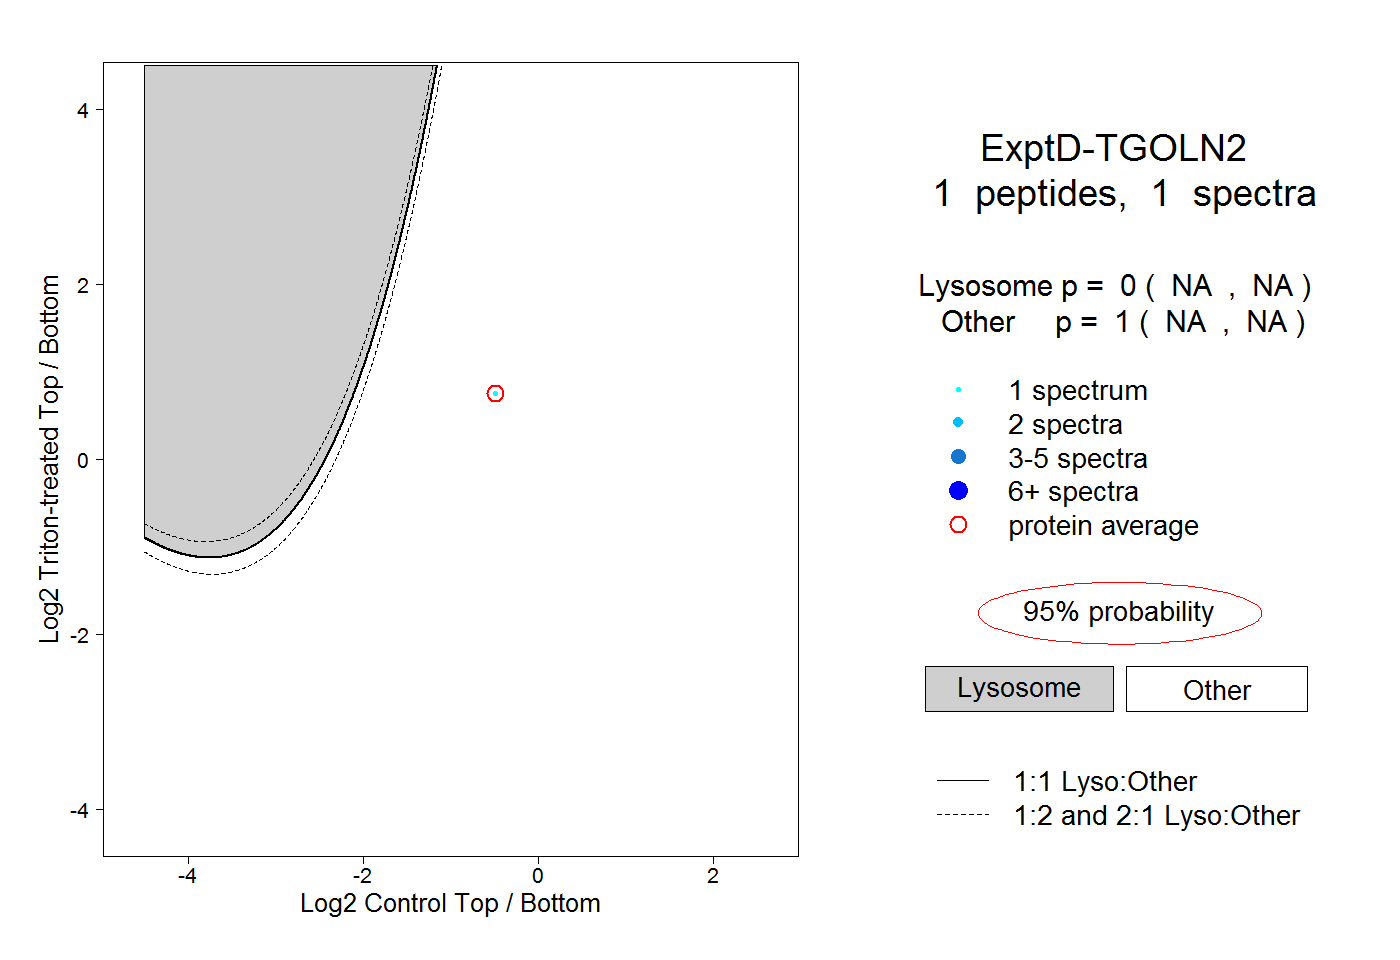 |
0.000 NA | NA |
1.000 NA | NA |