 3
3peptides
spectra
0.000 | 0.106
0.000 | 0.000
0.000 | 0.081
0.000 | 0.277
0.000 | 0.351
0.000 | 0.276
0.440 | 0.702
0.000 | 0.108
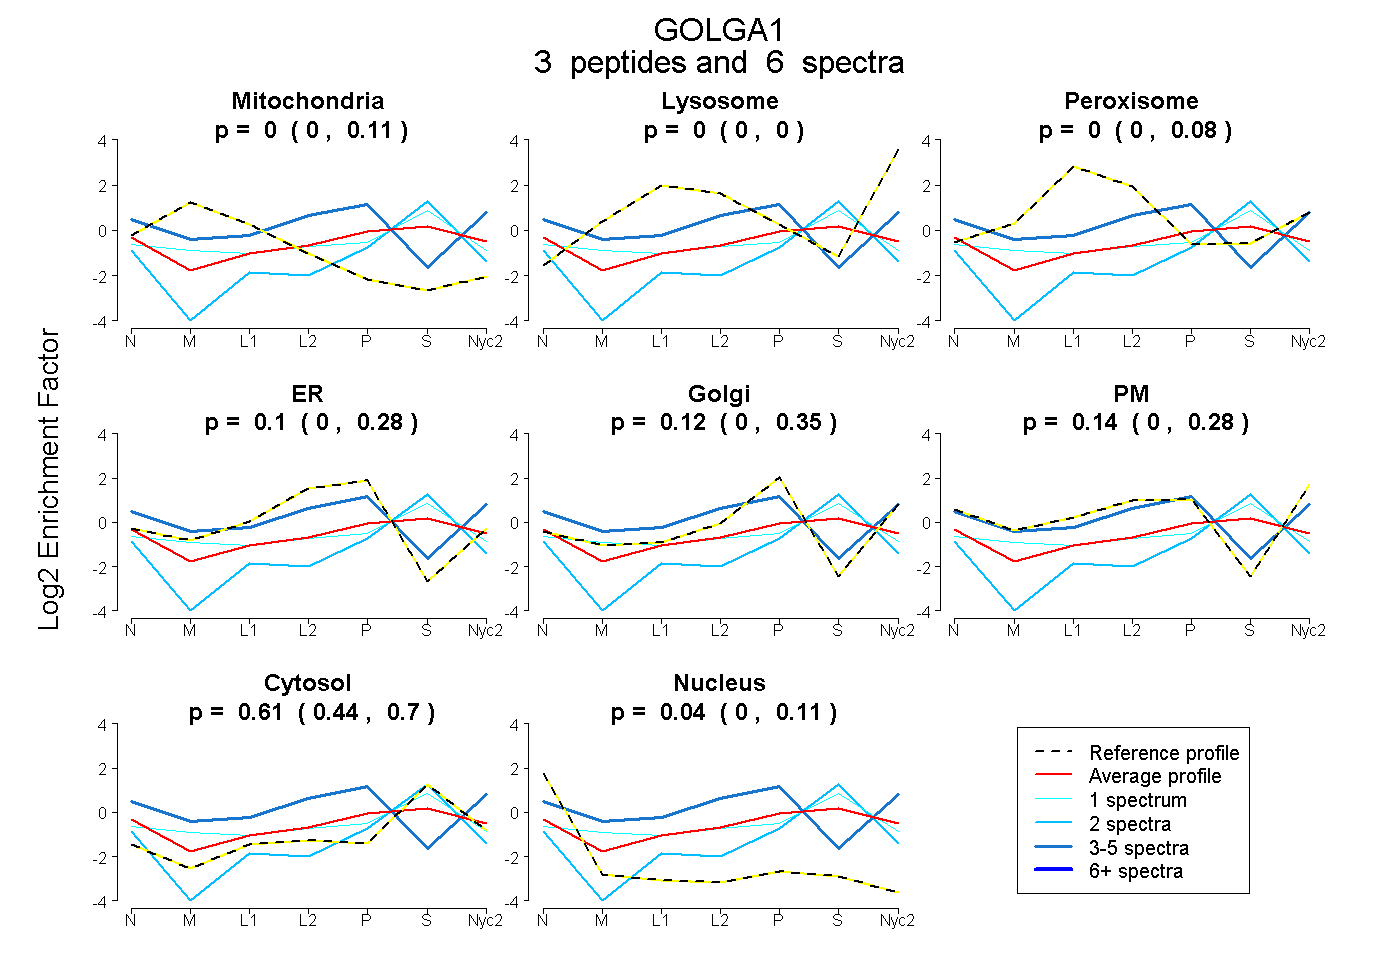
| Plot | Mito | Lyso | Perox | ER | Golgi | PM | Cytosol | Nucleus | |||||
| Expt A |
3 peptides |
6 spectra |
|
0.000 0.000 | 0.106 |
0.000 0.000 | 0.000 |
0.000 0.000 | 0.081 |
0.102 0.000 | 0.277 |
0.116 0.000 | 0.351 |
0.140 0.000 | 0.276 |
0.607 0.440 | 0.702 |
0.036 0.000 | 0.108 |