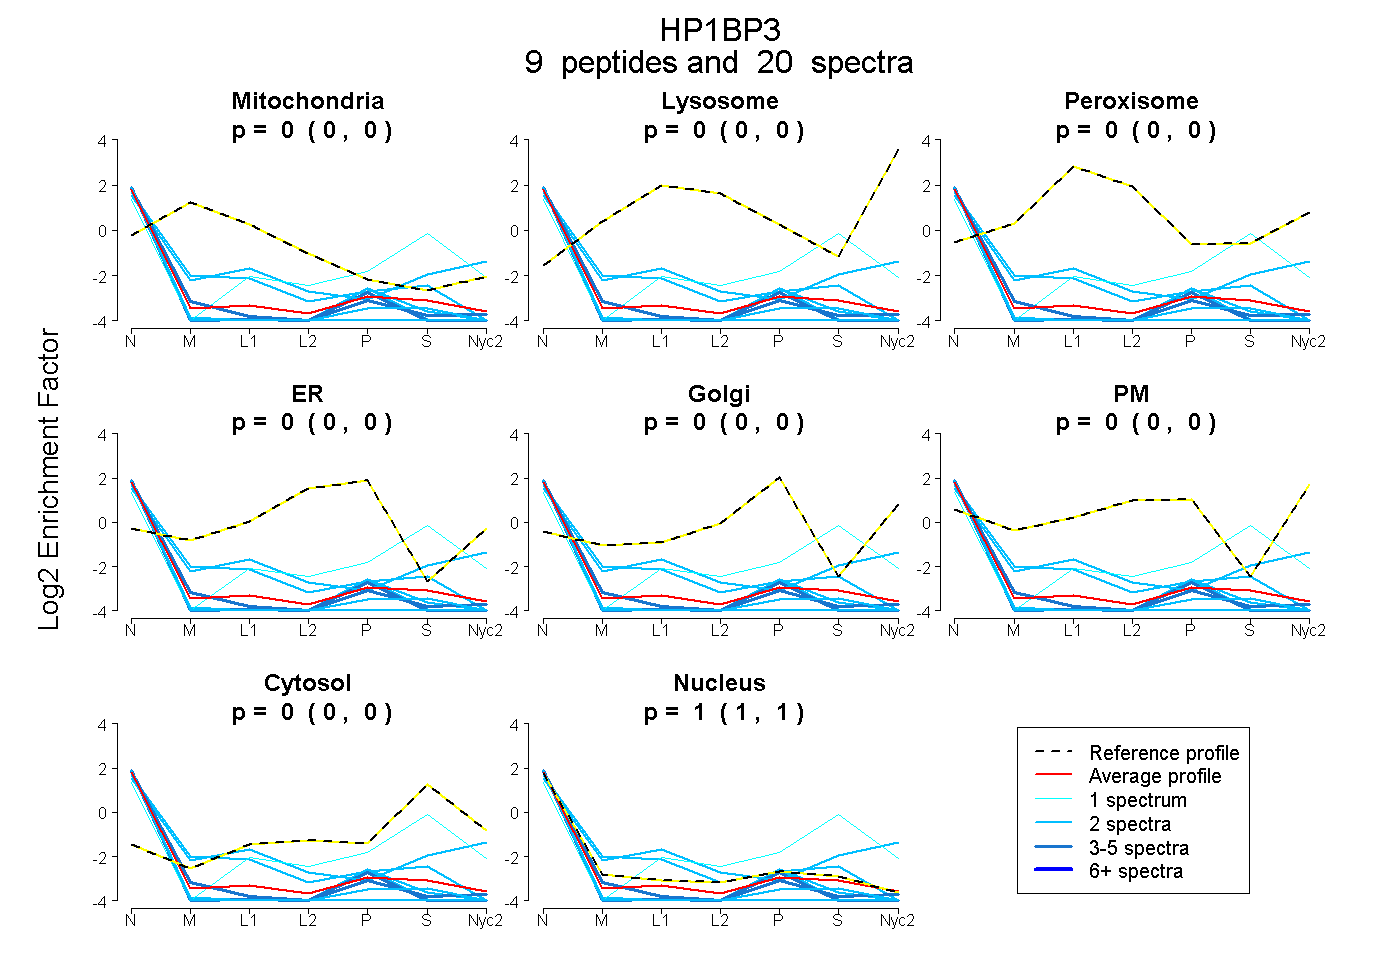
 9
9peptides
spectra
0.000 | 0.000
0.000 | 0.000
0.000 | 0.000
0.000 | 0.000
0.000 | 0.000
0.000 | 0.000
0.000 | 0.000
1.000 | 1.000
| Plot | Mito | Lyso | Perox | ER | Golgi | PM | Cytosol | Nucleus | |||||
| Expt A |
9 peptides |
20 spectra |
|
0.000 0.000 | 0.000 |
0.000 0.000 | 0.000 |
0.000 0.000 | 0.000 |
0.000 0.000 | 0.000 |
0.000 0.000 | 0.000 |
0.000 0.000 | 0.000 |
0.000 0.000 | 0.000 |
1.000 1.000 | 1.000 |
| 4 spectra, SGASVVAIR | 0.000 | 0.000 | 0.000 | 0.000 | 0.000 | 0.000 | 0.000 | 1.000 | ||
| 2 spectra, ALPLIVGAQLIHADK | 0.000 | 0.000 | 0.000 | 0.000 | 0.000 | 0.000 | 0.000 | 1.000 | ||
| 2 spectra, MDAILTEAIK | 0.000 | 0.192 | 0.000 | 0.000 | 0.000 | 0.000 | 0.053 | 0.755 | ||
| 3 spectra, KPVANAR | 0.000 | 0.000 | 0.000 | 0.000 | 0.000 | 0.000 | 0.000 | 1.000 | ||
| 2 spectra, AVNSTR | 0.000 | 0.000 | 0.000 | 0.000 | 0.000 | 0.000 | 0.000 | 1.000 | ||
| 2 spectra, LEDVLPLAFTR | 0.000 | 0.000 | 0.000 | 0.000 | 0.000 | 0.000 | 0.000 | 1.000 | ||
| 2 spectra, GSAVDPEPQVK | 0.161 | 0.000 | 0.000 | 0.000 | 0.000 | 0.000 | 0.000 | 0.839 | ||
| 2 spectra, VRPLPK | 0.000 | 0.000 | 0.000 | 0.000 | 0.000 | 0.000 | 0.000 | 1.000 | ||
| 1 spectrum, NGWLEQISGK | 0.000 | 0.000 | 0.000 | 0.000 | 0.000 | 0.000 | 0.482 | 0.518 |
| Plot | Mito | Lyso or Perox | ER | Golgi | PM | Cytosol | Nucleus | ||||||
| Expt B |
2 peptides |
2 spectra |
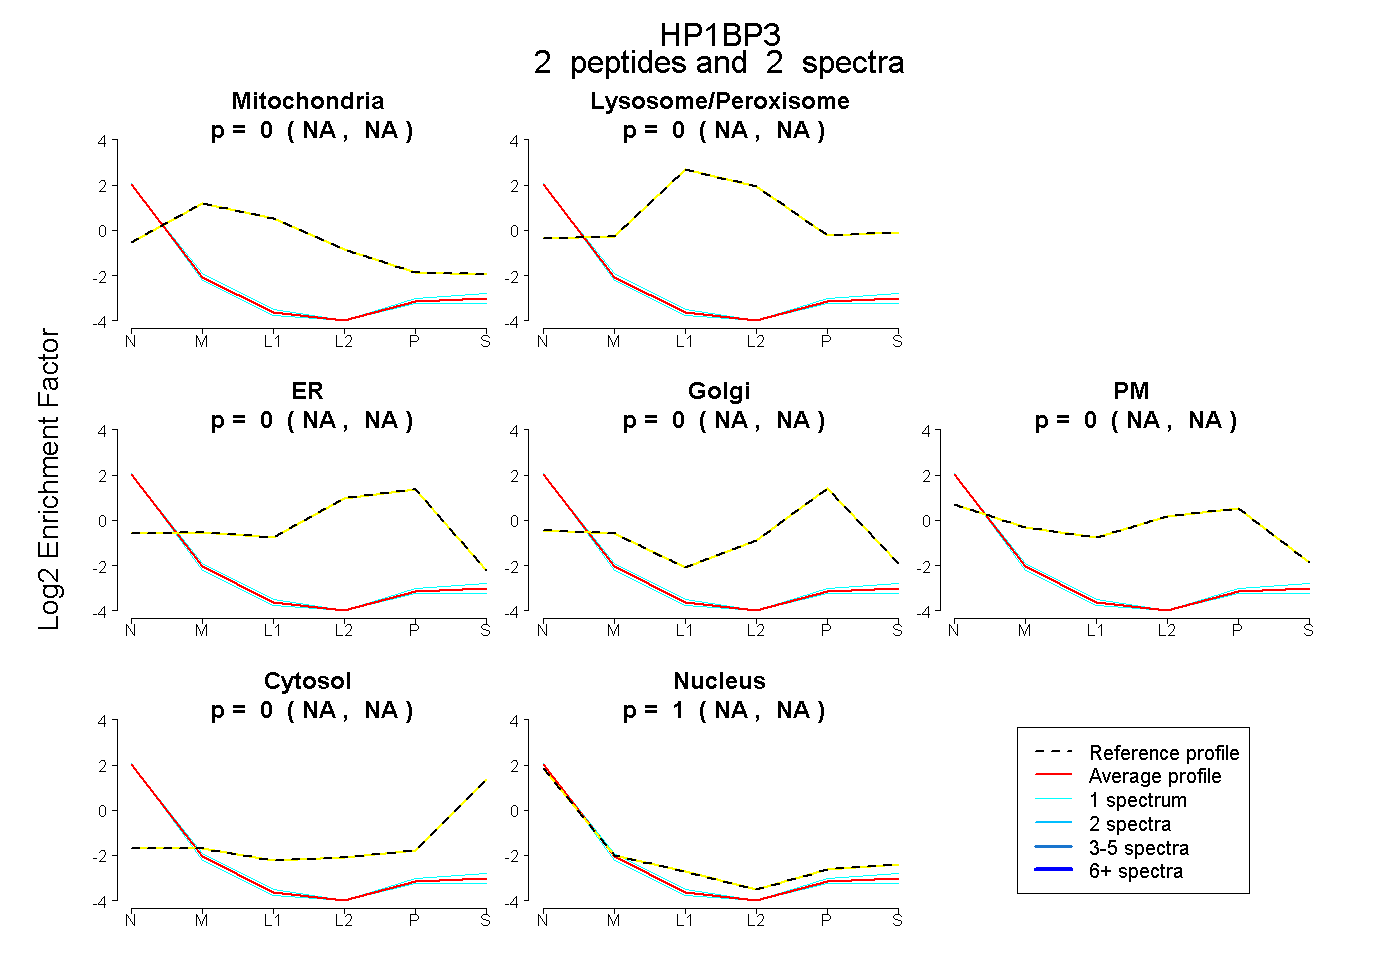 |
0.000 NA | NA |
0.000 NA | NA |
0.000 NA | NA |
0.000 NA | NA |
0.000 NA | NA |
0.000 NA | NA |
1.000 NA | NA |