 3
3peptides
spectra
0.000 | 0.000
0.056 | 0.249
0.000 | 0.000
0.000 | 0.256
0.000 | 0.248
0.384 | 0.743
0.000 | 0.086
0.000 | 0.000
3peptides
spectra
0.000 | 0.000
1.000 | 1.000
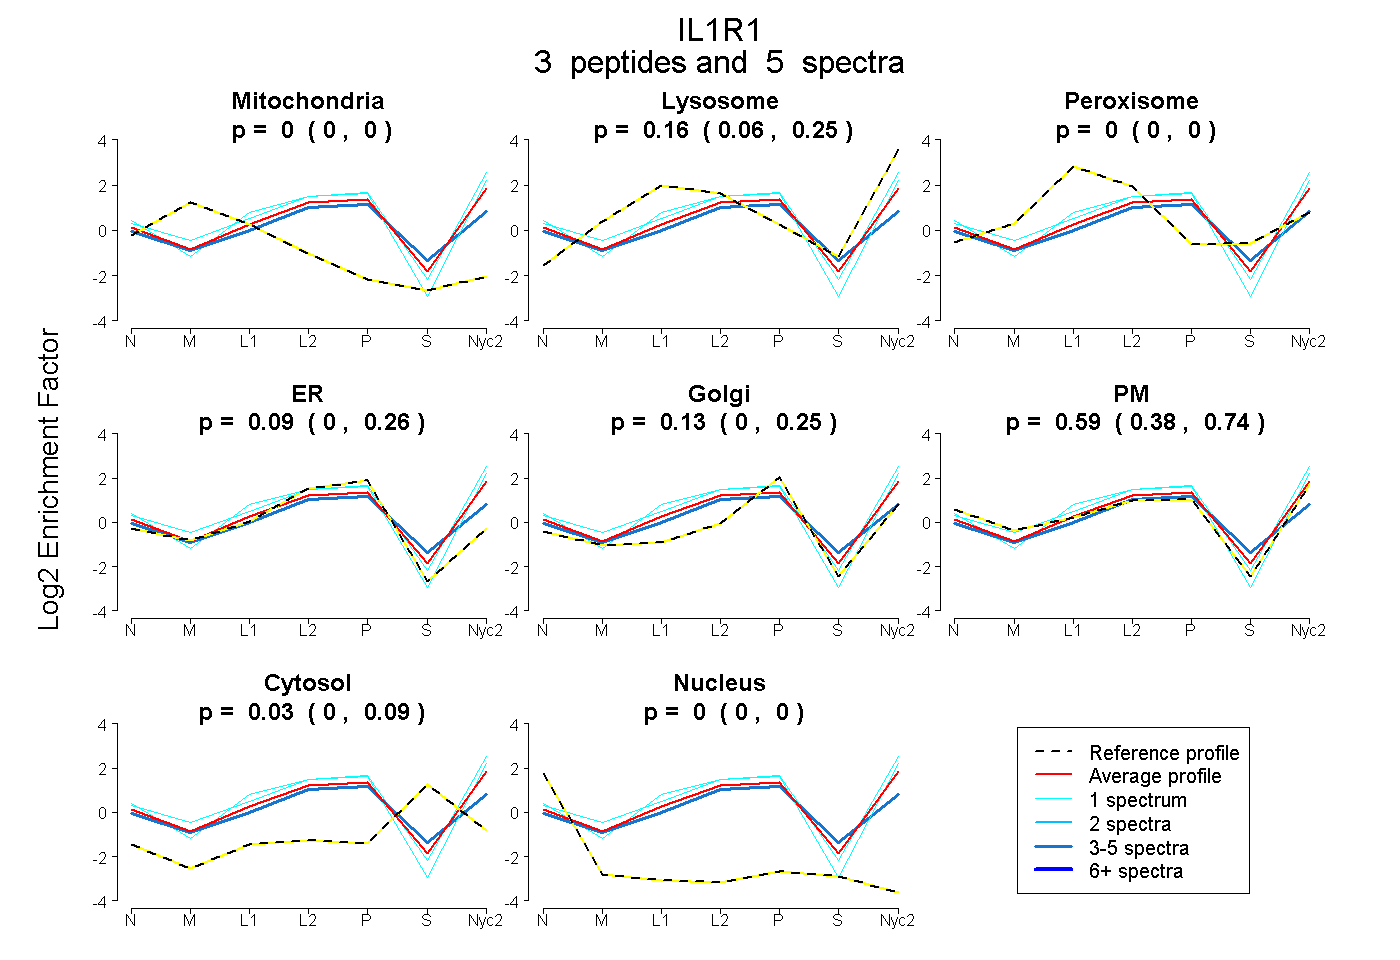
| Plot | Mito | Lyso | Perox | ER | Golgi | PM | Cytosol | Nucleus | |||||
| Expt A |
3 peptides |
5 spectra |
|
0.000 0.000 | 0.000 |
0.163 0.056 | 0.249 |
0.000 0.000 | 0.000 |
0.090 0.000 | 0.256 |
0.133 0.000 | 0.248 |
0.586 0.384 | 0.743 |
0.029 0.000 | 0.086 |
0.000 0.000 | 0.000 |
||
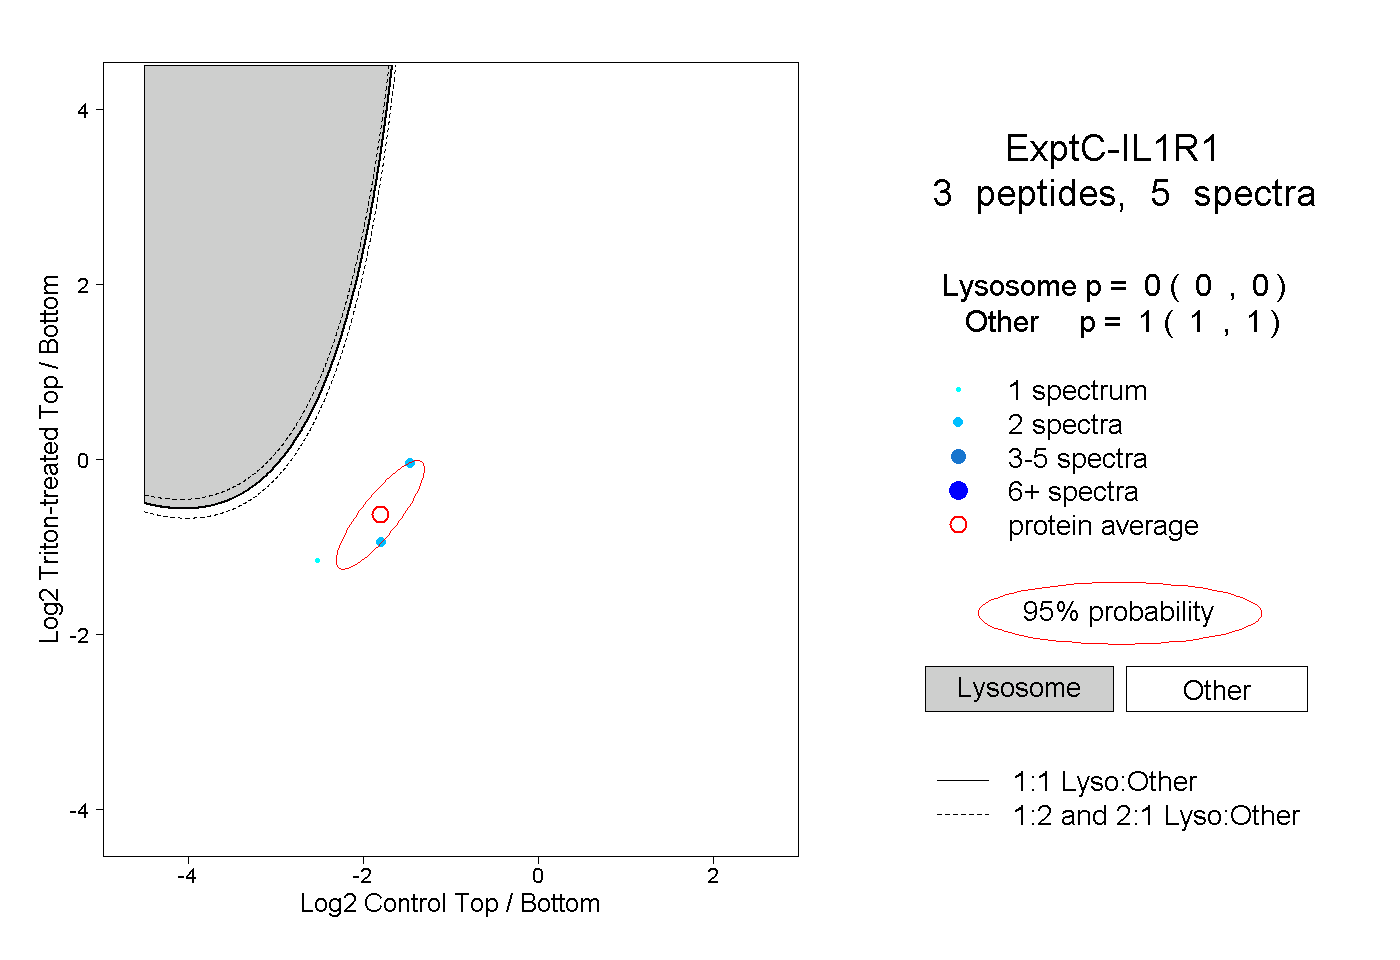
| Plot | Lyso | Other | |||||||||||
| Expt C |
3 peptides |
5 spectra |
|
0.000 0.000 | 0.000 |
1.000 1.000 | 1.000 |