 2
2peptides
spectra
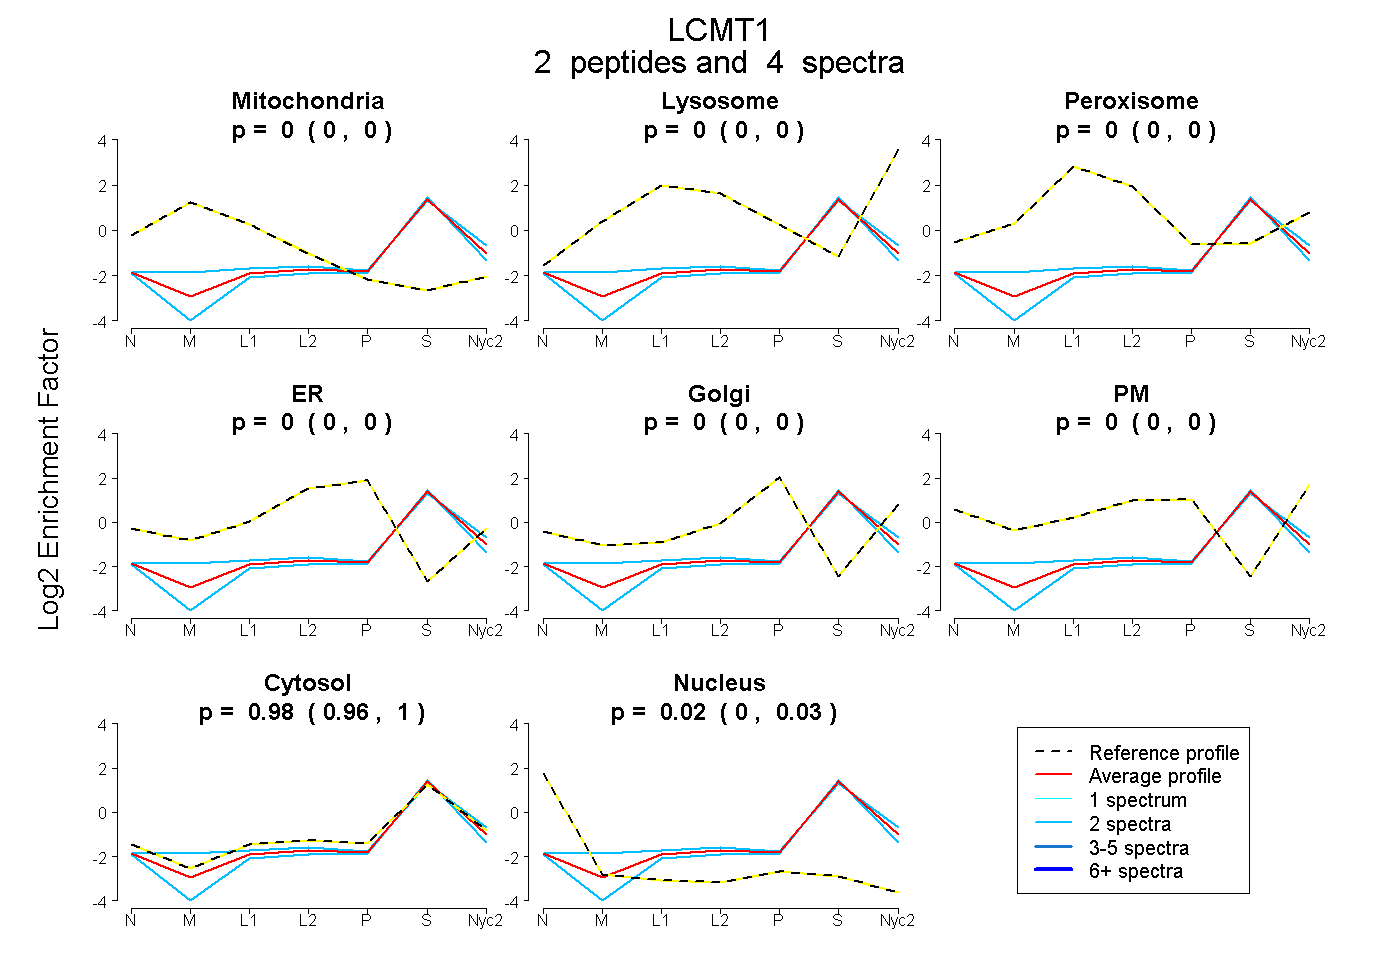
0.000 | 0.000
0.000 | 0.000
0.000 | 0.000
0.000 | 0.000
0.000 | 0.000
0.000 | 0.000
0.962 | 1.000
0.000 | 0.035
| Plot | Mito | Lyso | Perox | ER | Golgi | PM | Cytosol | Nucleus | |||||
| Expt A |
2 peptides |
4 spectra |
|
0.000 0.000 | 0.000 |
0.000 0.000 | 0.000 |
0.000 0.000 | 0.000 |
0.000 0.000 | 0.000 |
0.000 0.000 | 0.000 |
0.000 0.000 | 0.000 |
0.982 0.962 | 1.000 |
0.018 0.000 | 0.035 |
| 2 spectra, YFEVDFPMIVTR | 0.038 | 0.000 | 0.000 | 0.000 | 0.000 | 0.000 | 0.962 | 0.000 | ||
| 2 spectra, DLSELEEK | 0.000 | 0.000 | 0.000 | 0.000 | 0.000 | 0.000 | 0.946 | 0.054 |
| Plot | Lyso | Other | |||||||||||
| Expt C |
1 peptide |
2 spectra |
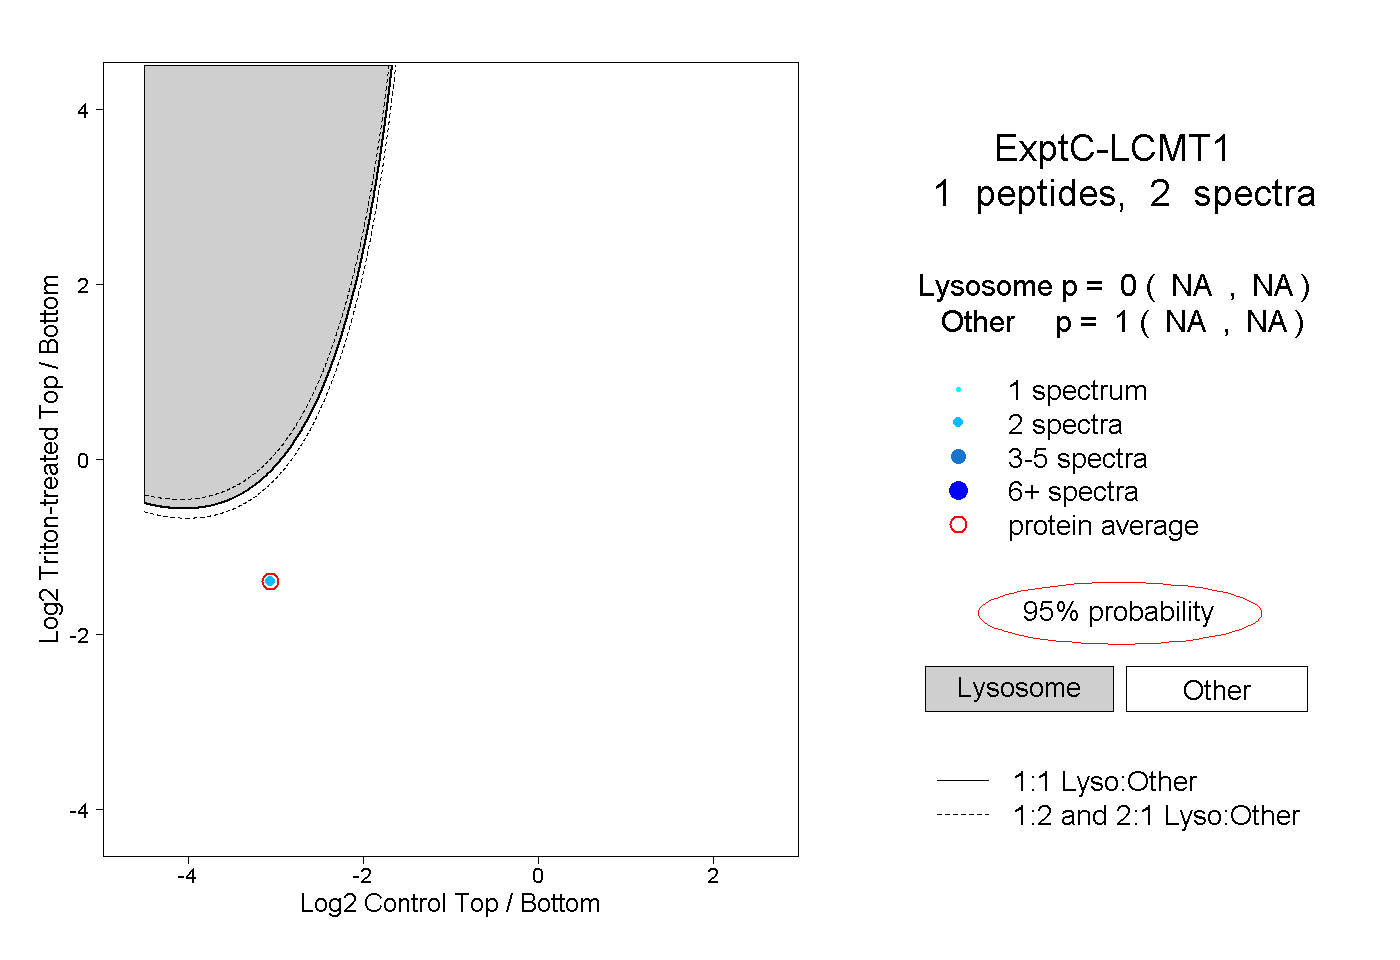 |
0.000 NA | NA |
1.000 NA | NA |