 3
3peptides
spectra
0.000 | 0.221
0.000 | 0.072
0.000 | 0.180
0.000 | 0.346
0.000 | 0.300
0.000 | 0.318
0.428 | 0.620
0.000 | 0.082
| Plot | Mito | Lyso | Perox | ER | Golgi | PM | Cytosol | Nucleus | |||||
| Expt A |
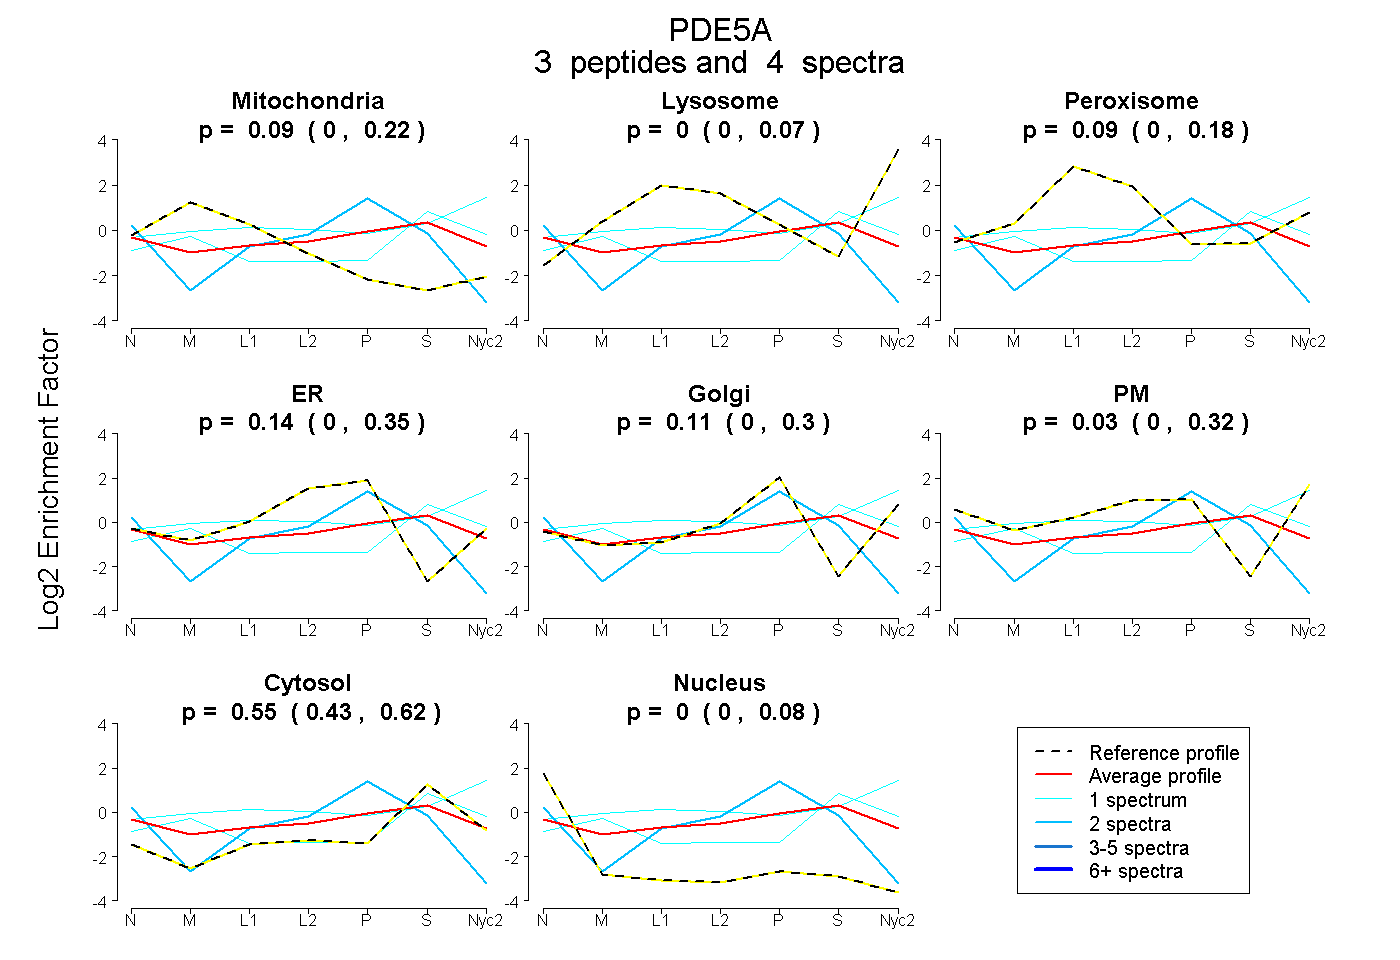
3 peptides |
4 spectra |
|
0.086 0.000 | 0.221 |
0.000 0.000 | 0.072 |
0.090 0.000 | 0.180 |
0.140 0.000 | 0.346 |
0.107 0.000 | 0.300 |
0.028 0.000 | 0.318 |
0.550 0.428 | 0.620 |
0.000 0.000 | 0.082 |