 5
5peptides
spectra
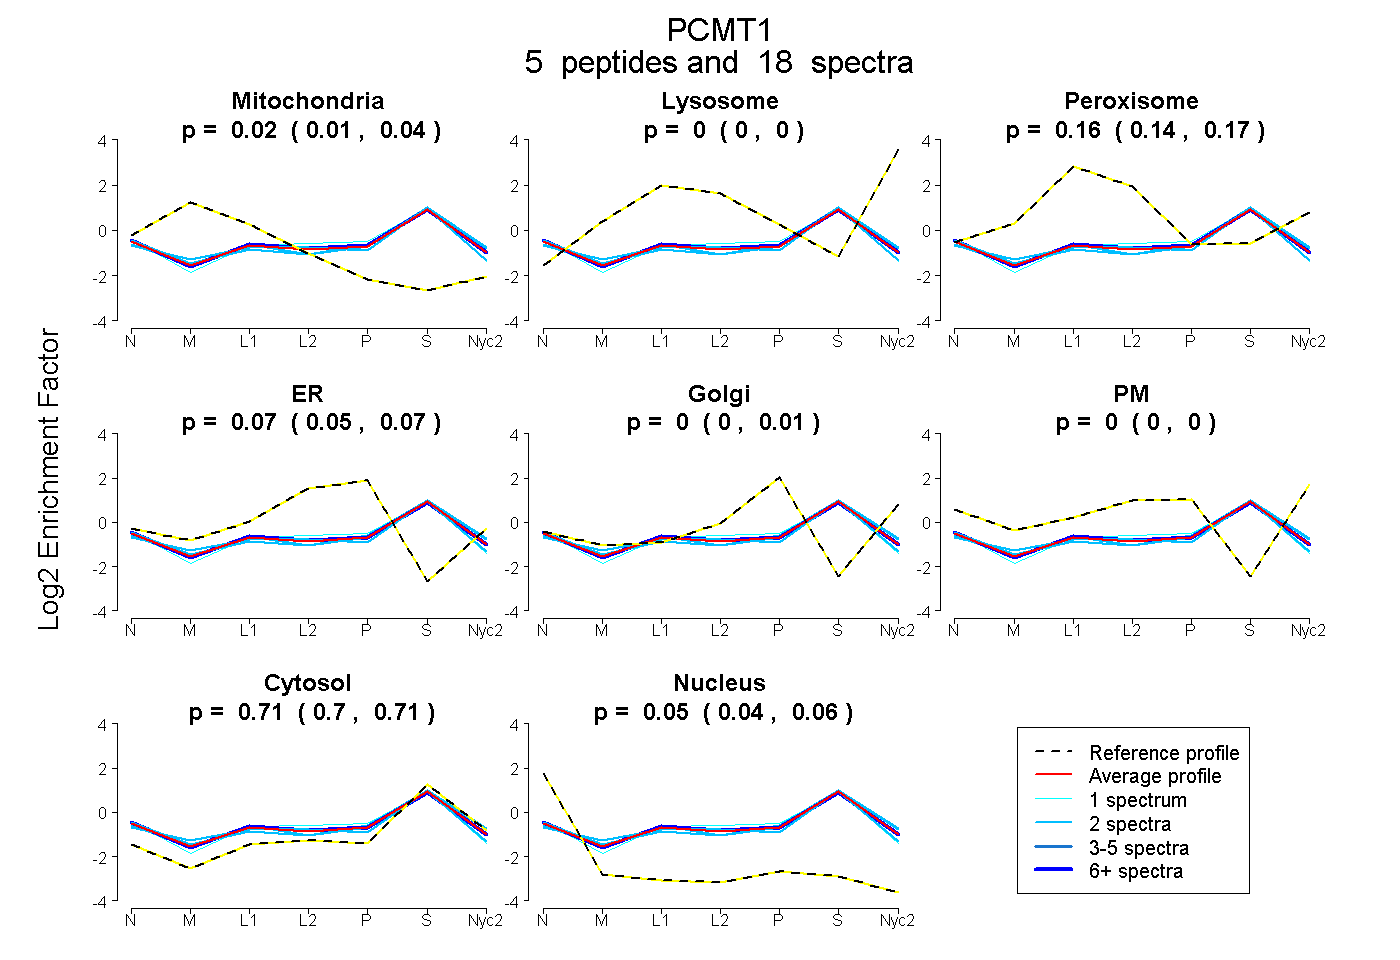
0.009 | 0.036
0.000 | 0.000
0.144 | 0.168
0.049 | 0.073
0.000 | 0.011
0.000 | 0.000
0.699 | 0.713
0.035 | 0.056
2peptides
spectra
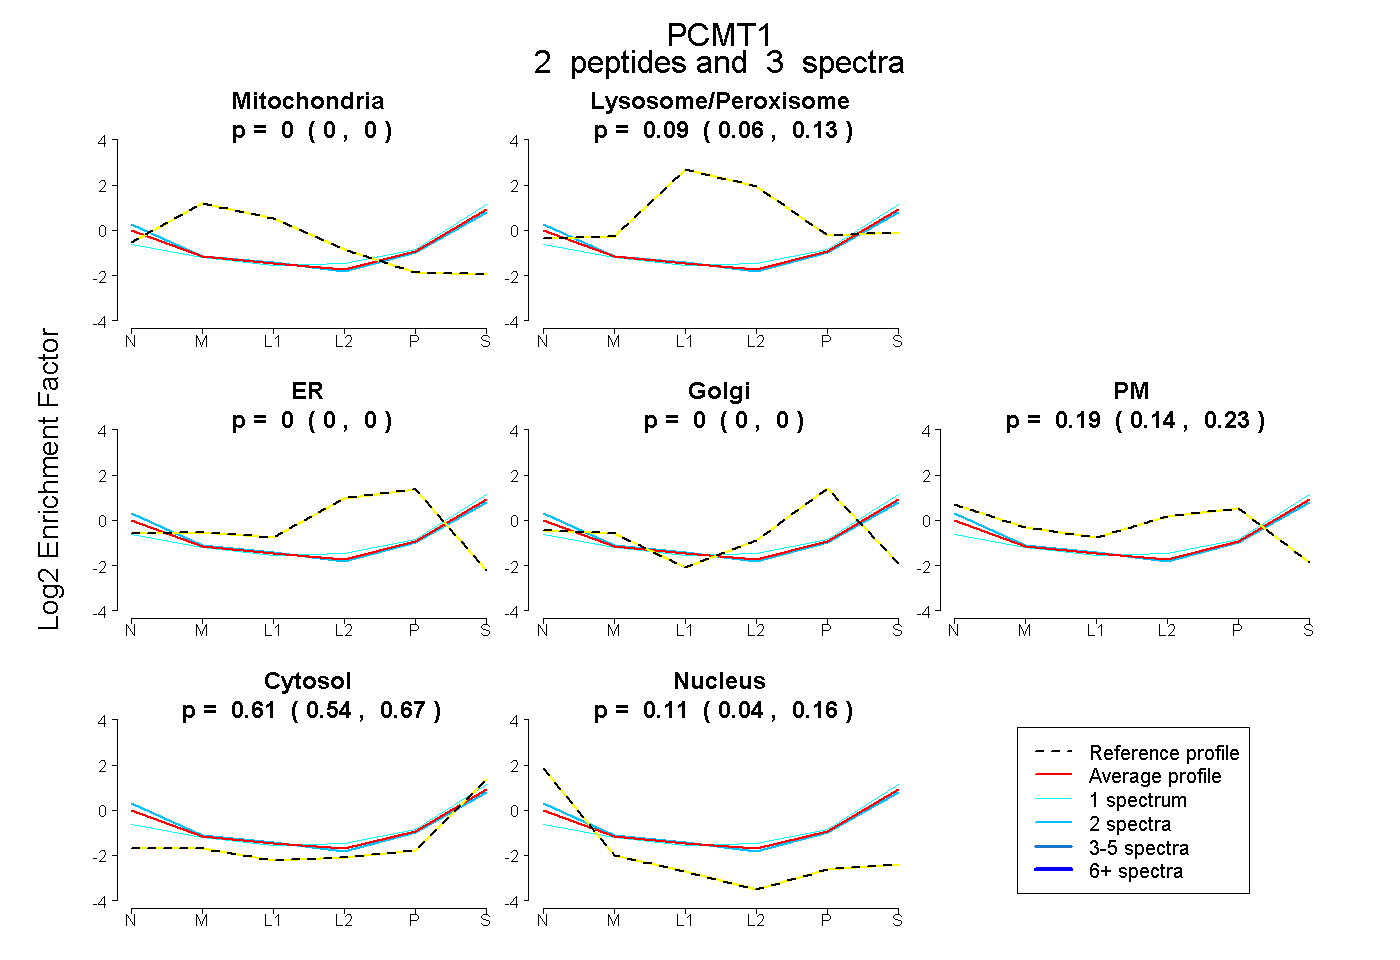
0.000 | 0.000
0.057 | 0.127
0.000 | 0.000
0.000 | 0.000
0.137 | 0.234
0.538 | 0.669
0.038 | 0.161
6peptides
spectra
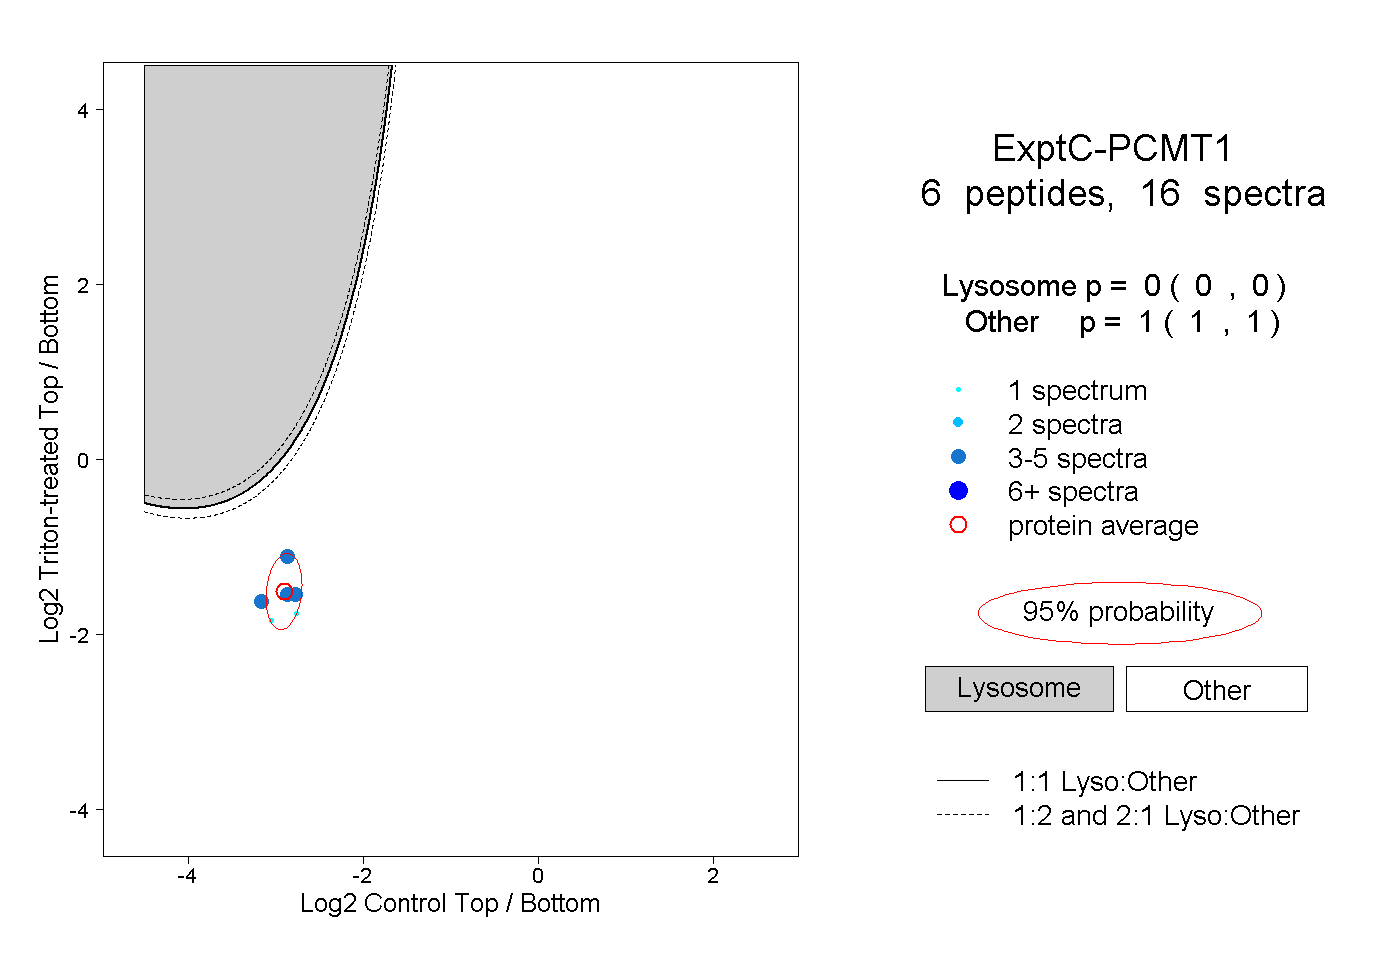
0.000 | 0.000
1.000 | 1.000
3peptides
spectra
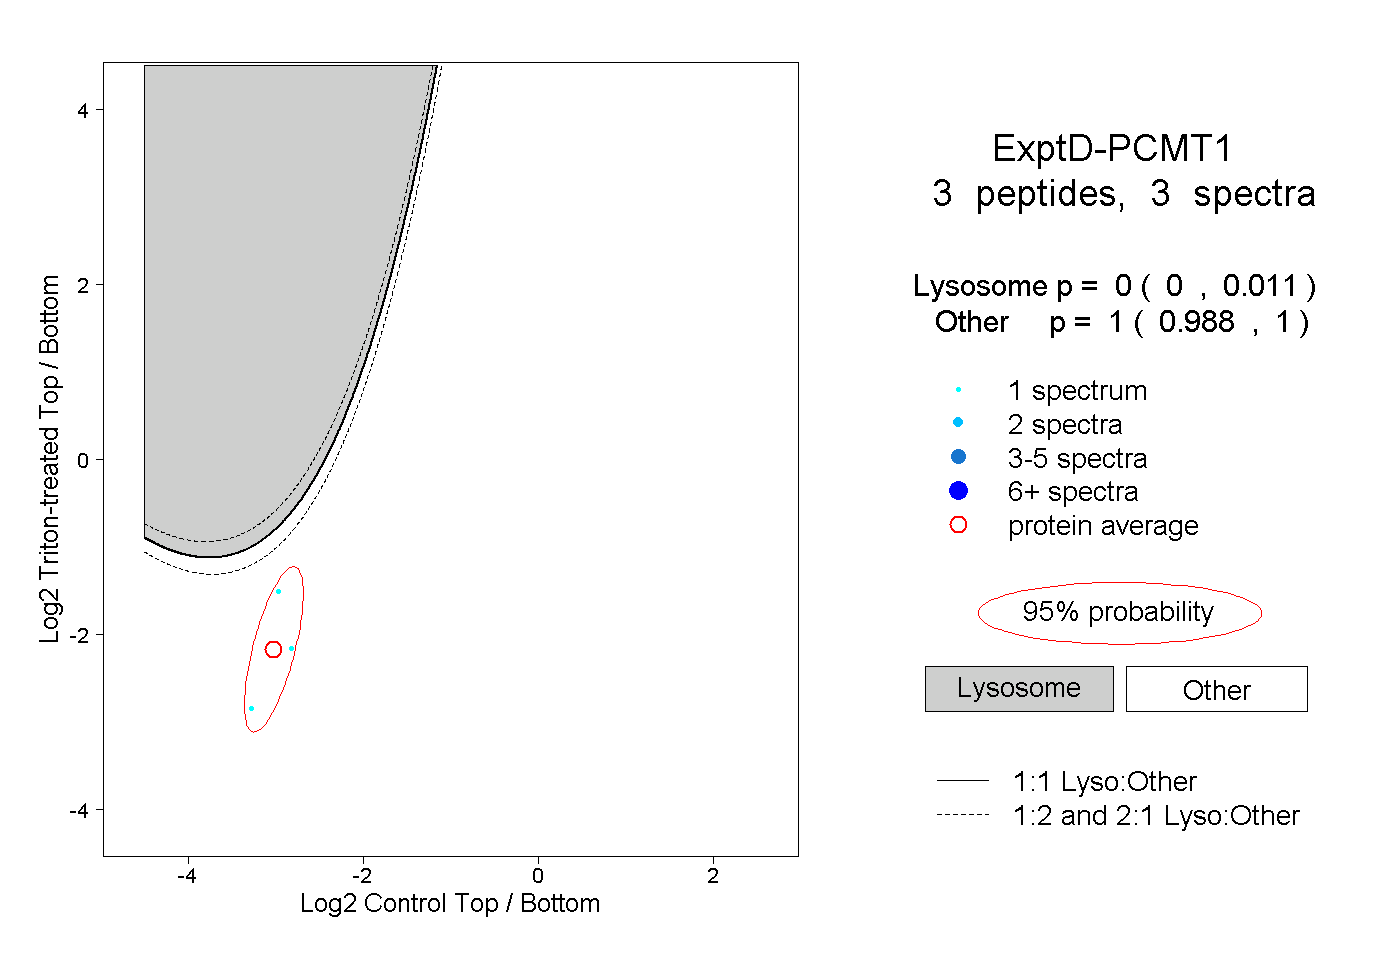
0.000 | 0.011
0.988 | 1.000