 5
5peptides
spectra
0.000 | 0.000
0.000 | 0.000
0.000 | 0.000
0.425 | 0.501
0.336 | 0.432
0.000 | 0.000
0.073 | 0.096
0.046 | 0.071
| Plot | Mito | Lyso | Perox | ER | Golgi | PM | Cytosol | Nucleus | |||||
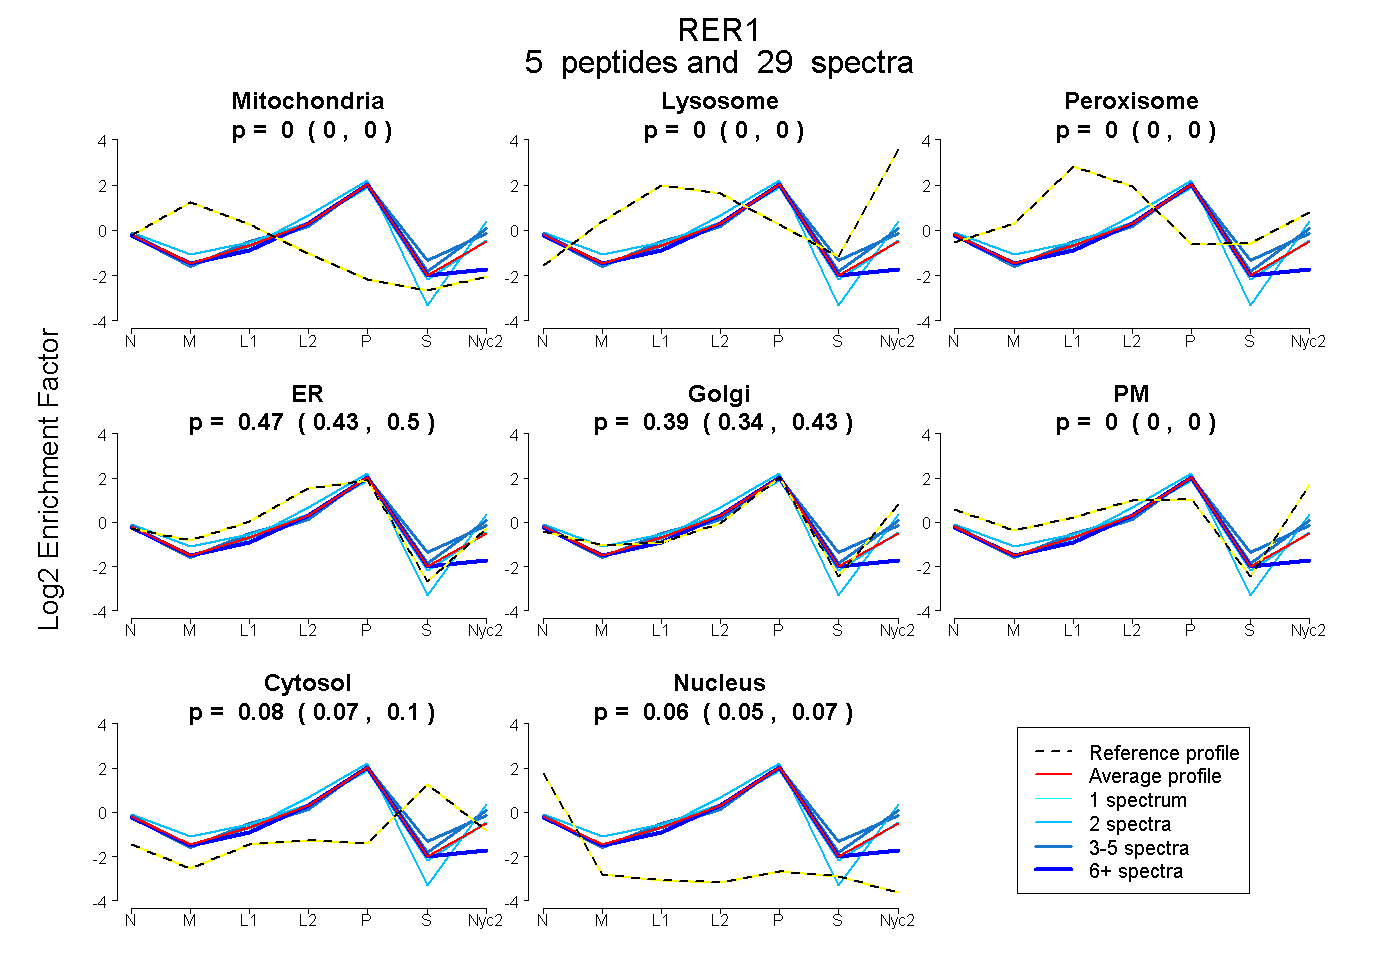
| Expt A |
5 peptides |
29 spectra |
|
0.000 0.000 | 0.000 |
0.000 0.000 | 0.000 |
0.000 0.000 | 0.000 |
0.467 0.425 | 0.501 |
0.388 0.336 | 0.432 |
0.000 0.000 | 0.000 |
0.085 0.073 | 0.096 |
0.060 0.046 | 0.071 |
| 3 spectra, STPYTAVR | 0.000 | 0.000 | 0.000 | 0.273 | 0.609 | 0.000 | 0.103 | 0.015 | ||
| 2 spectra, QNEEFRPFIR | 0.000 | 0.000 | 0.000 | 0.401 | 0.585 | 0.000 | 0.000 | 0.015 | ||
| 18 spectra, YIPFTHGK | 0.000 | 0.000 | 0.000 | 0.734 | 0.025 | 0.000 | 0.082 | 0.160 | ||
| 4 spectra, FWHAATK | 0.000 | 0.000 | 0.000 | 0.375 | 0.434 | 0.000 | 0.191 | 0.000 | ||
| 2 spectra, LGQIYQSWLDK | 0.000 | 0.000 | 0.000 | 0.526 | 0.358 | 0.000 | 0.042 | 0.074 |
| Plot | Mito | Lyso or Perox | ER | Golgi | PM | Cytosol | Nucleus | ||||||
| Expt B |
5 peptides |
19 spectra |
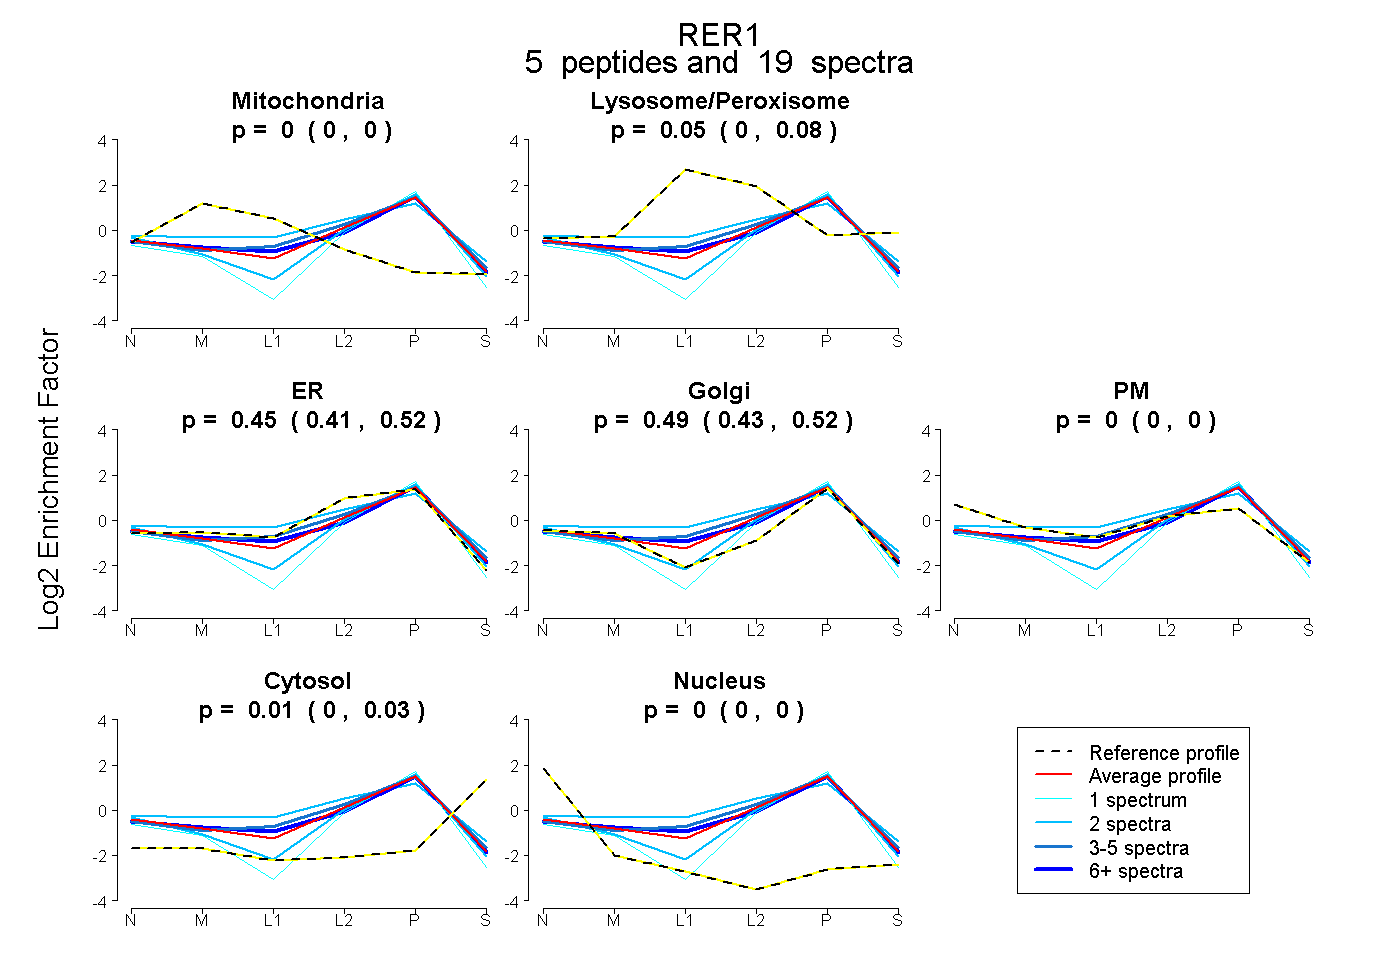 |
0.000 0.000 | 0.000 |
0.048 0.000 | 0.076 |
0.453 0.405 | 0.519 |
0.494 0.435 | 0.520 |
0.000 0.000 | 0.000 |
0.005 0.000 | 0.025 |
0.000 0.000 | 0.000 |
|||
| Plot | Lyso | Other | |||||||||||
| Expt C |
5 peptides |
28 spectra |
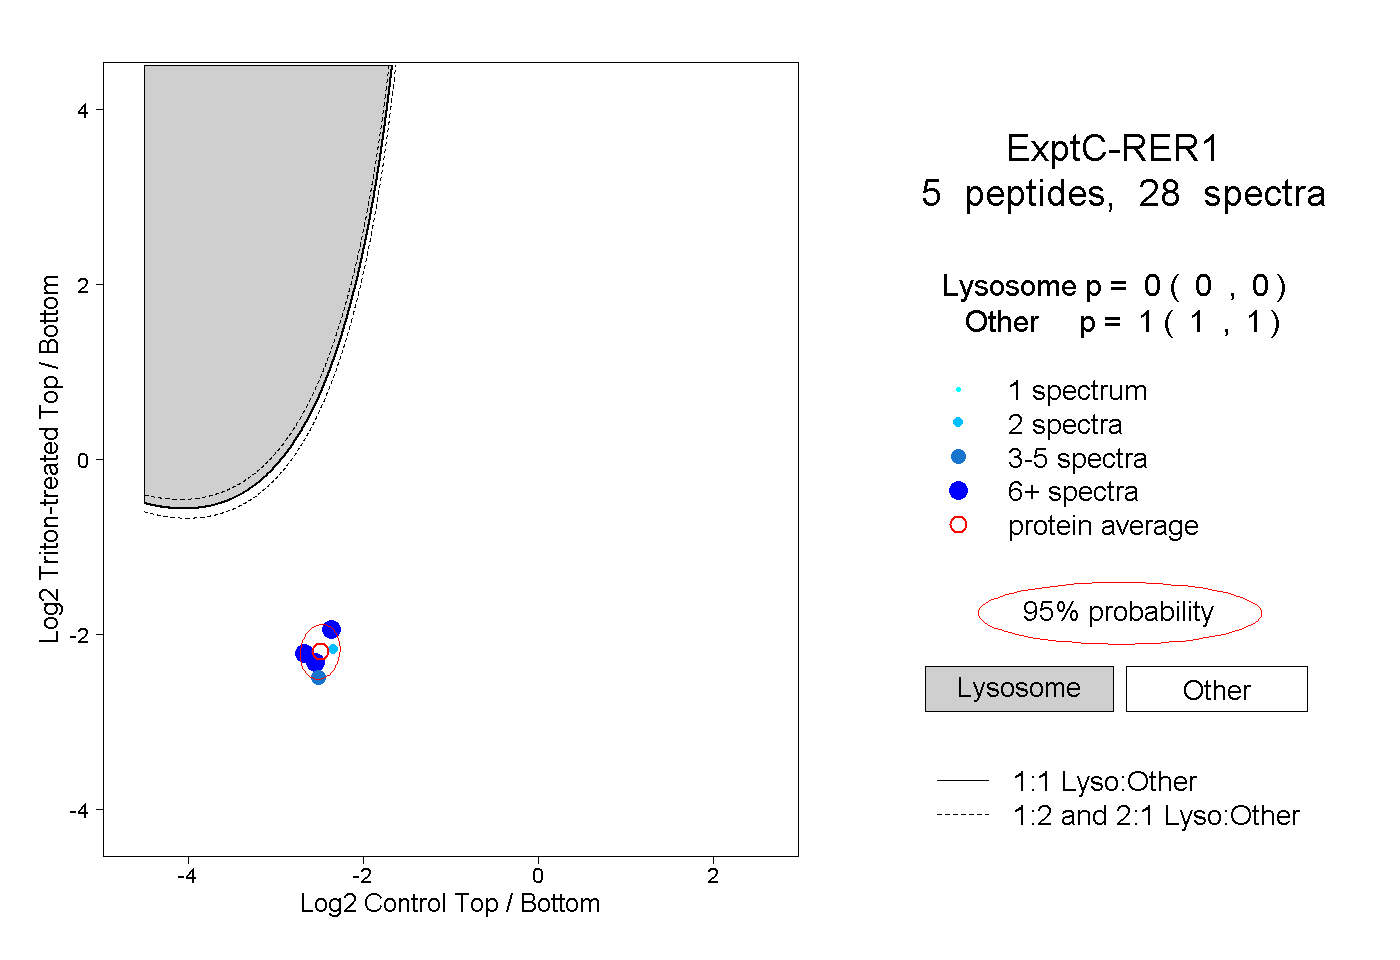 |
0.000 0.000 | 0.000 |
1.000 1.000 | 1.000 |
||||||||
| Plot | Lyso | Other | |||||||||||
| Expt D |
2 peptides |
3 spectra |
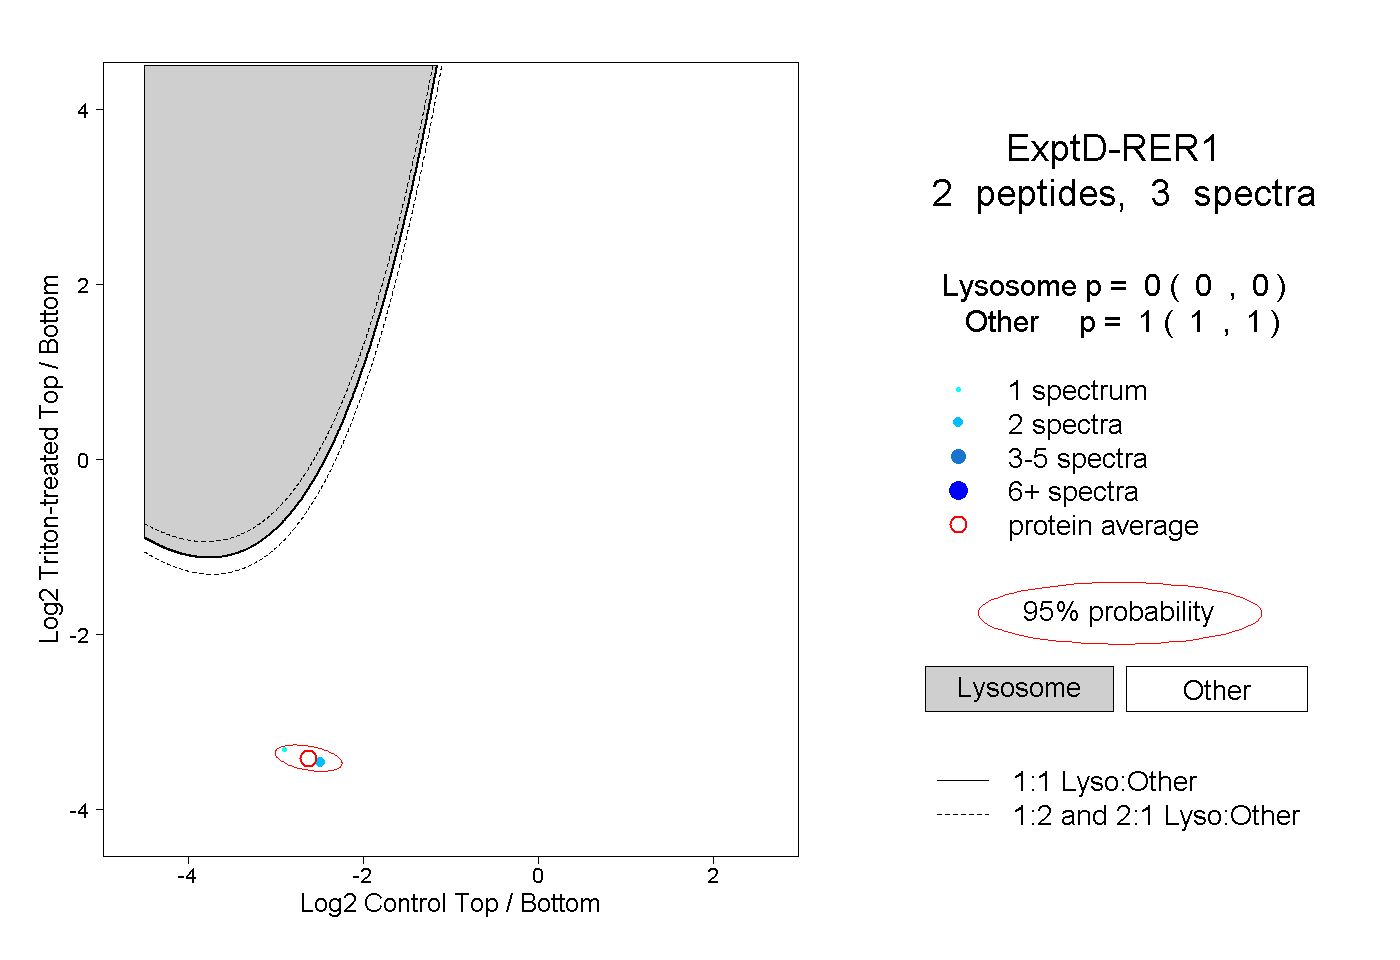 |
0.000 0.000 | 0.000 |
1.000 1.000 | 1.000 |