 6
6peptides
spectra
0.000 | 0.000
0.000 | 0.000
0.000 | 0.043
0.000 | 0.138
0.000 | 0.185
0.000 | 0.155
0.158 | 0.263
0.542 | 0.634
1peptide
spectra
NA | NA
NA | NA
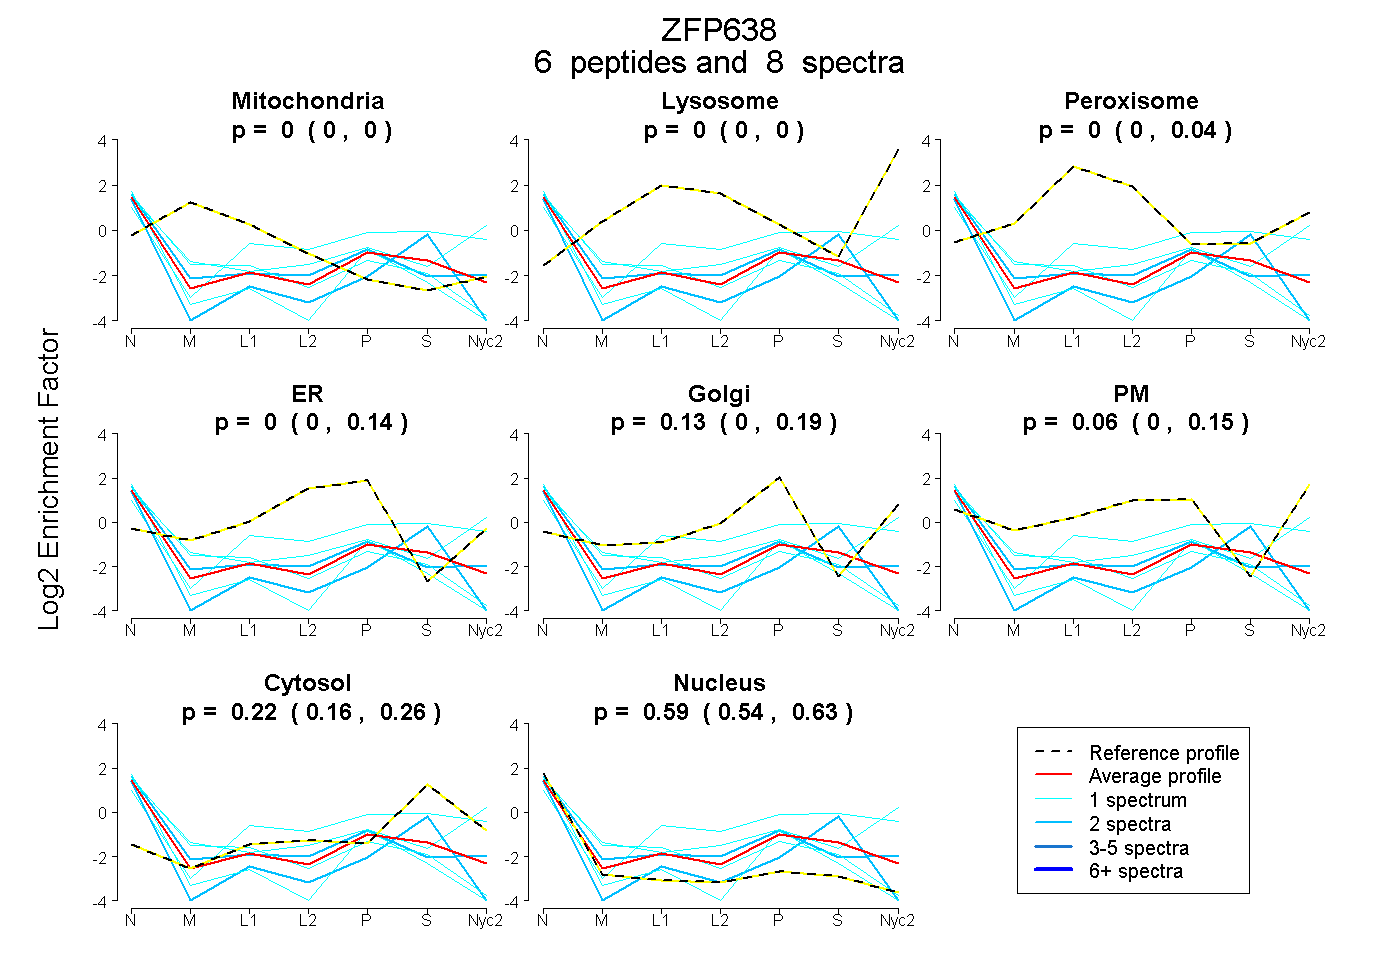
| Plot | Mito | Lyso | Perox | ER | Golgi | PM | Cytosol | Nucleus | |||||
| Expt A |
6 peptides |
8 spectra |
|
0.000 0.000 | 0.000 |
0.000 0.000 | 0.000 |
0.003 0.000 | 0.043 |
0.000 0.000 | 0.138 |
0.125 0.000 | 0.185 |
0.062 0.000 | 0.155 |
0.222 0.158 | 0.263 |
0.589 0.542 | 0.634 |
||
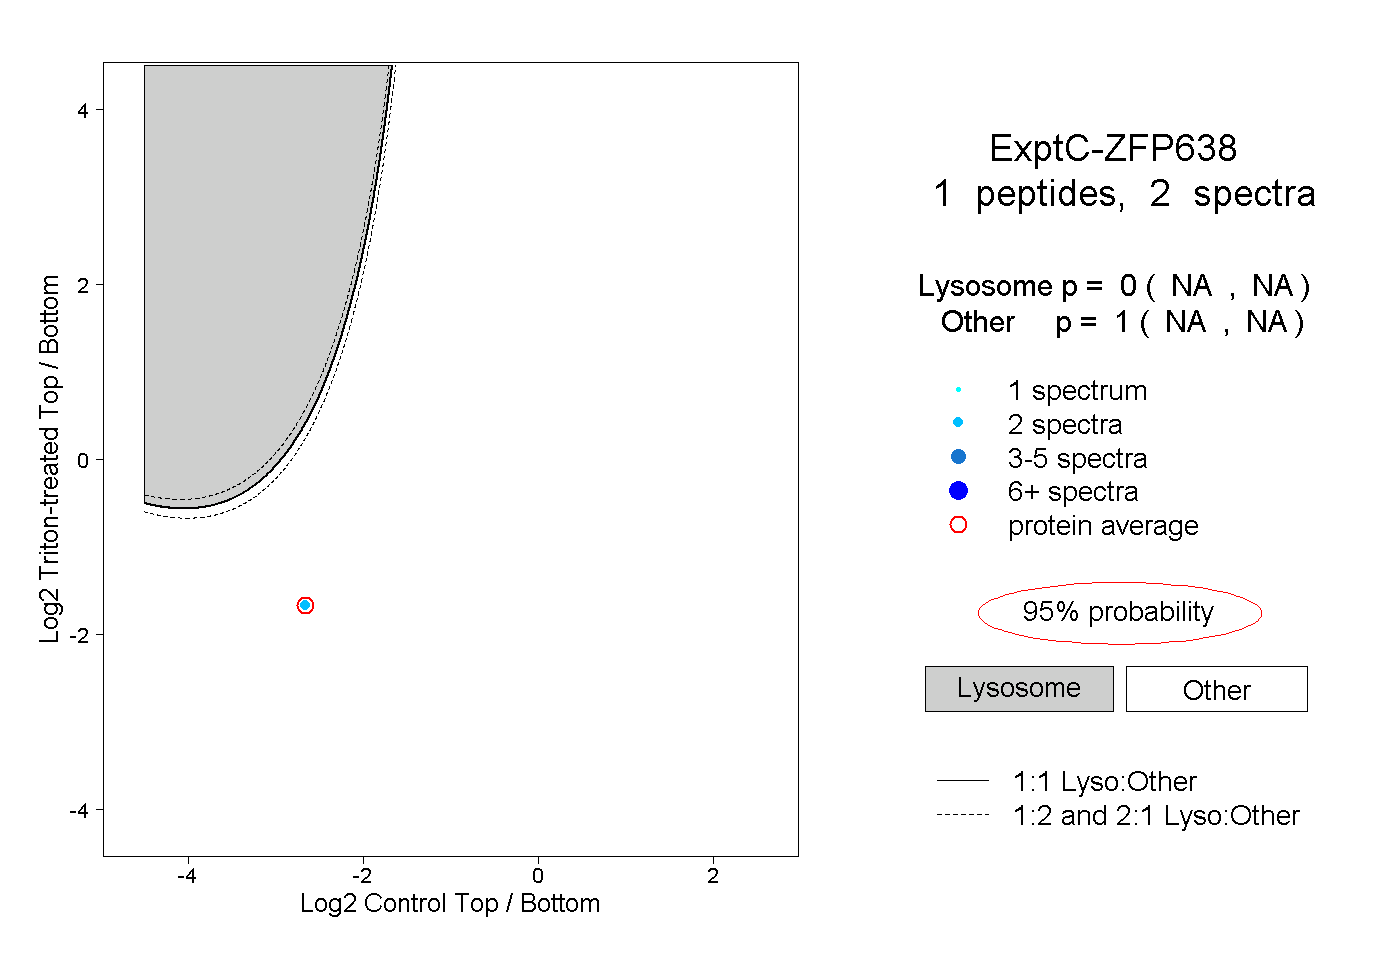
| Plot | Lyso | Other | |||||||||||
| Expt C |
1 peptide |
2 spectra |
|
0.000 NA | NA |
1.000 NA | NA |