 2
2peptides
spectra
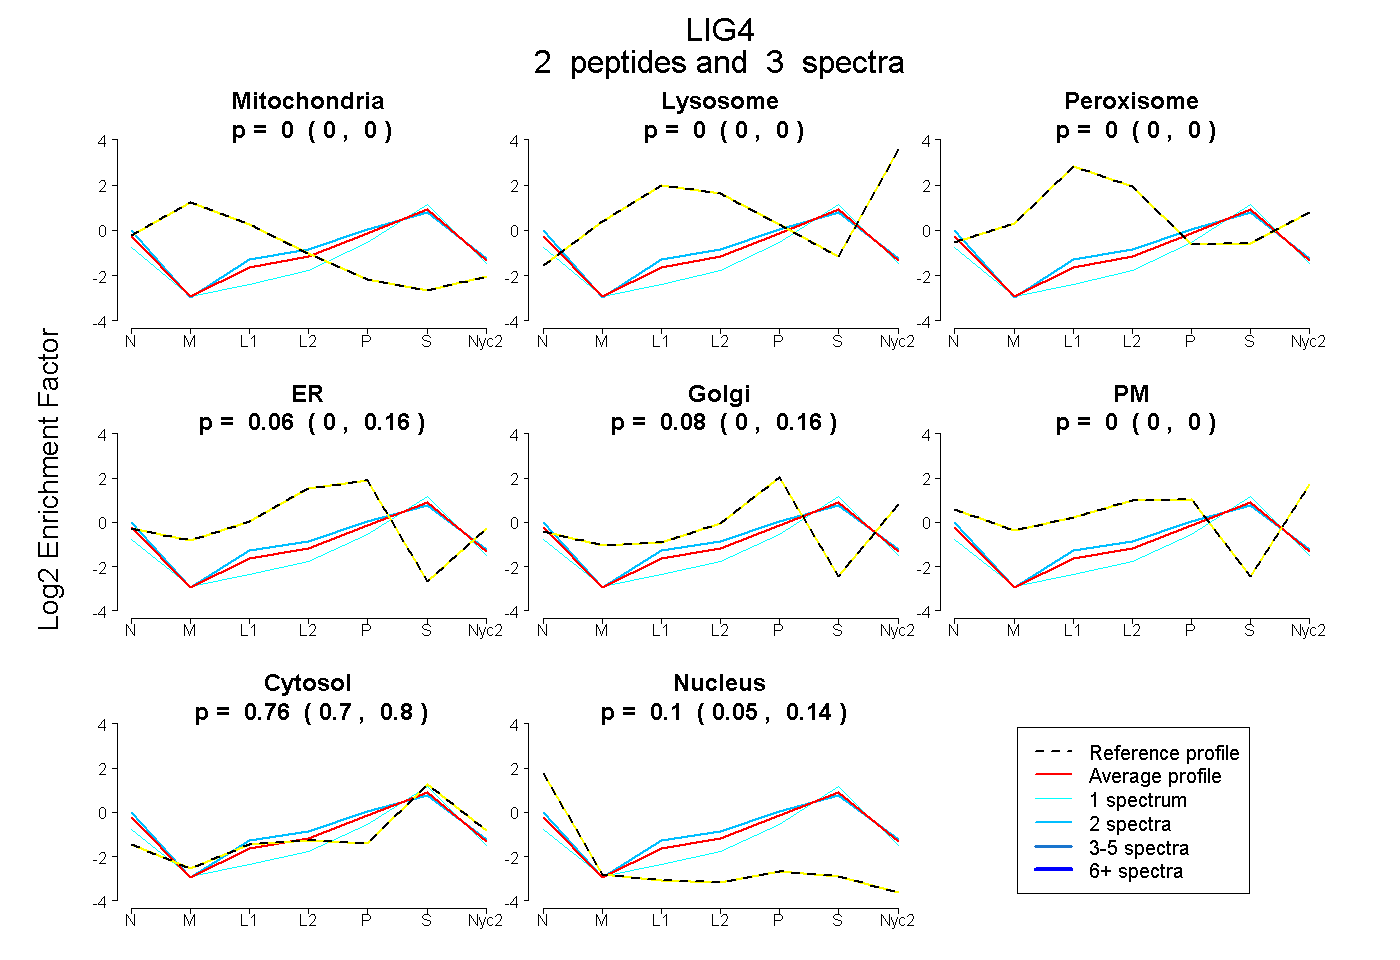
0.000 | 0.000
0.000 | 0.000
0.000 | 0.000
0.000 | 0.163
0.000 | 0.159
0.000 | 0.000
0.705 | 0.801
0.053 | 0.139
| Plot | Mito | Lyso | Perox | ER | Golgi | PM | Cytosol | Nucleus | |||||
| Expt A |
2 peptides |
3 spectra |
|
0.000 0.000 | 0.000 |
0.000 0.000 | 0.000 |
0.000 0.000 | 0.000 |
0.059 0.000 | 0.163 |
0.082 0.000 | 0.159 |
0.000 0.000 | 0.000 |
0.758 0.705 | 0.801 |
0.101 0.053 | 0.139 |
| 2 spectra, HLHIGDDDEPR | 0.000 | 0.000 | 0.000 | 0.200 | 0.000 | 0.000 | 0.713 | 0.086 | ||
| 1 spectrum, EFLDSWR | 0.000 | 0.000 | 0.000 | 0.000 | 0.012 | 0.000 | 0.855 | 0.134 |
| Plot | Lyso | Other | |||||||||||
| Expt C |
1 peptide |
2 spectra |
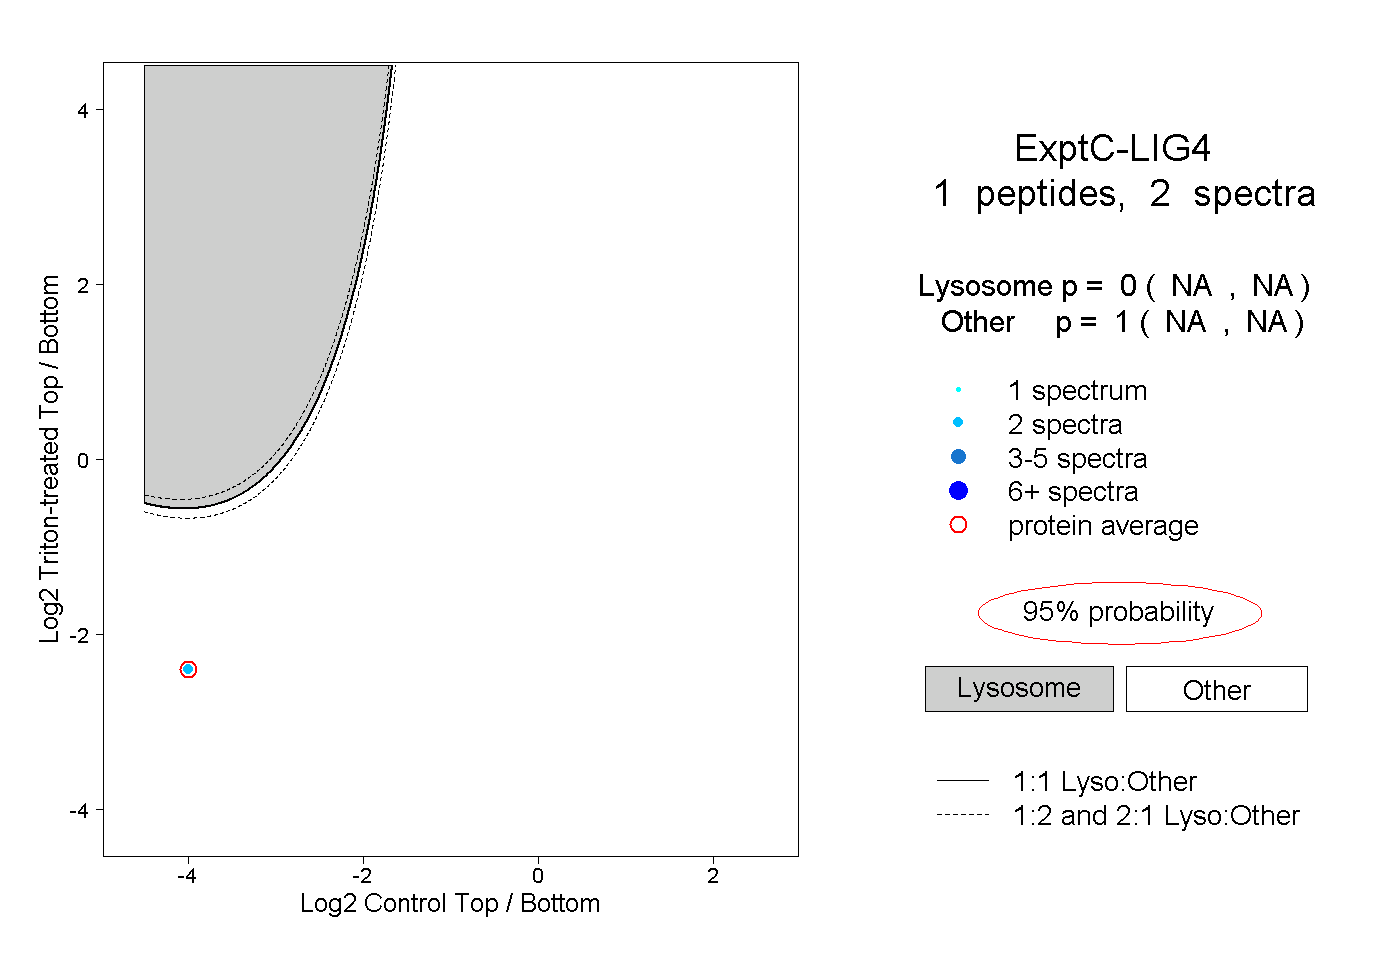 |
0.000 NA | NA |
1.000 NA | NA |