 3
3peptides
spectra
0.000 | 0.090
0.004 | 0.188
0.000 | 0.207
0.298 | 0.671
0.000 | 0.214
0.000 | 0.176
0.023 | 0.296
0.000 | 0.010
1peptide
spectrum
NA | NA
NA | NA
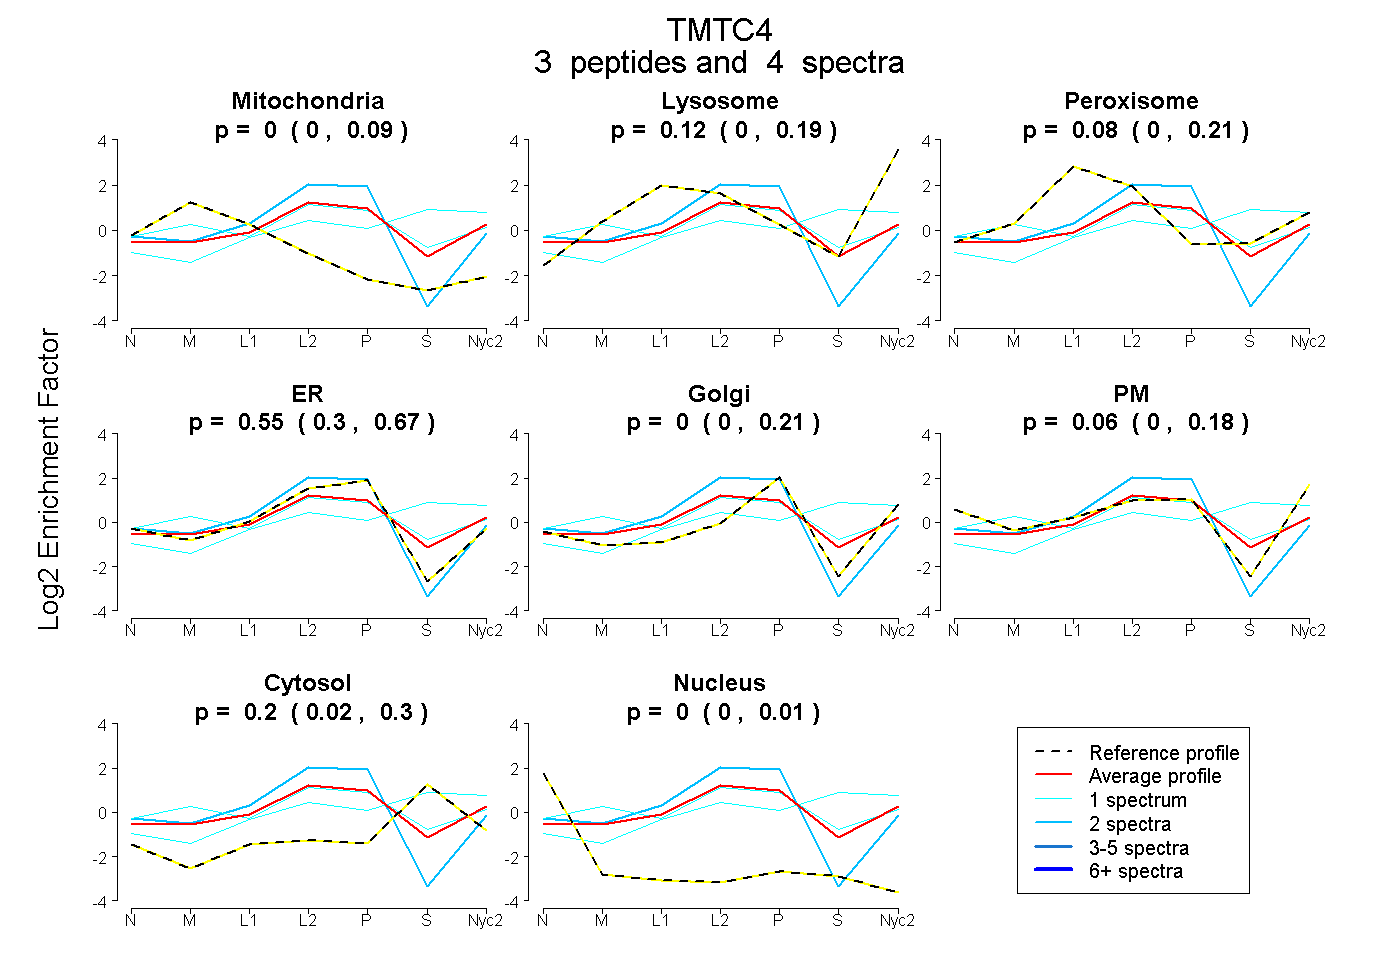
| Plot | Mito | Lyso | Perox | ER | Golgi | PM | Cytosol | Nucleus | |||||
| Expt A |
3 peptides |
4 spectra |
|
0.000 0.000 | 0.090 |
0.116 0.004 | 0.188 |
0.075 0.000 | 0.207 |
0.548 0.298 | 0.671 |
0.000 0.000 | 0.214 |
0.058 0.000 | 0.176 |
0.202 0.023 | 0.296 |
0.000 0.000 | 0.010 |
||
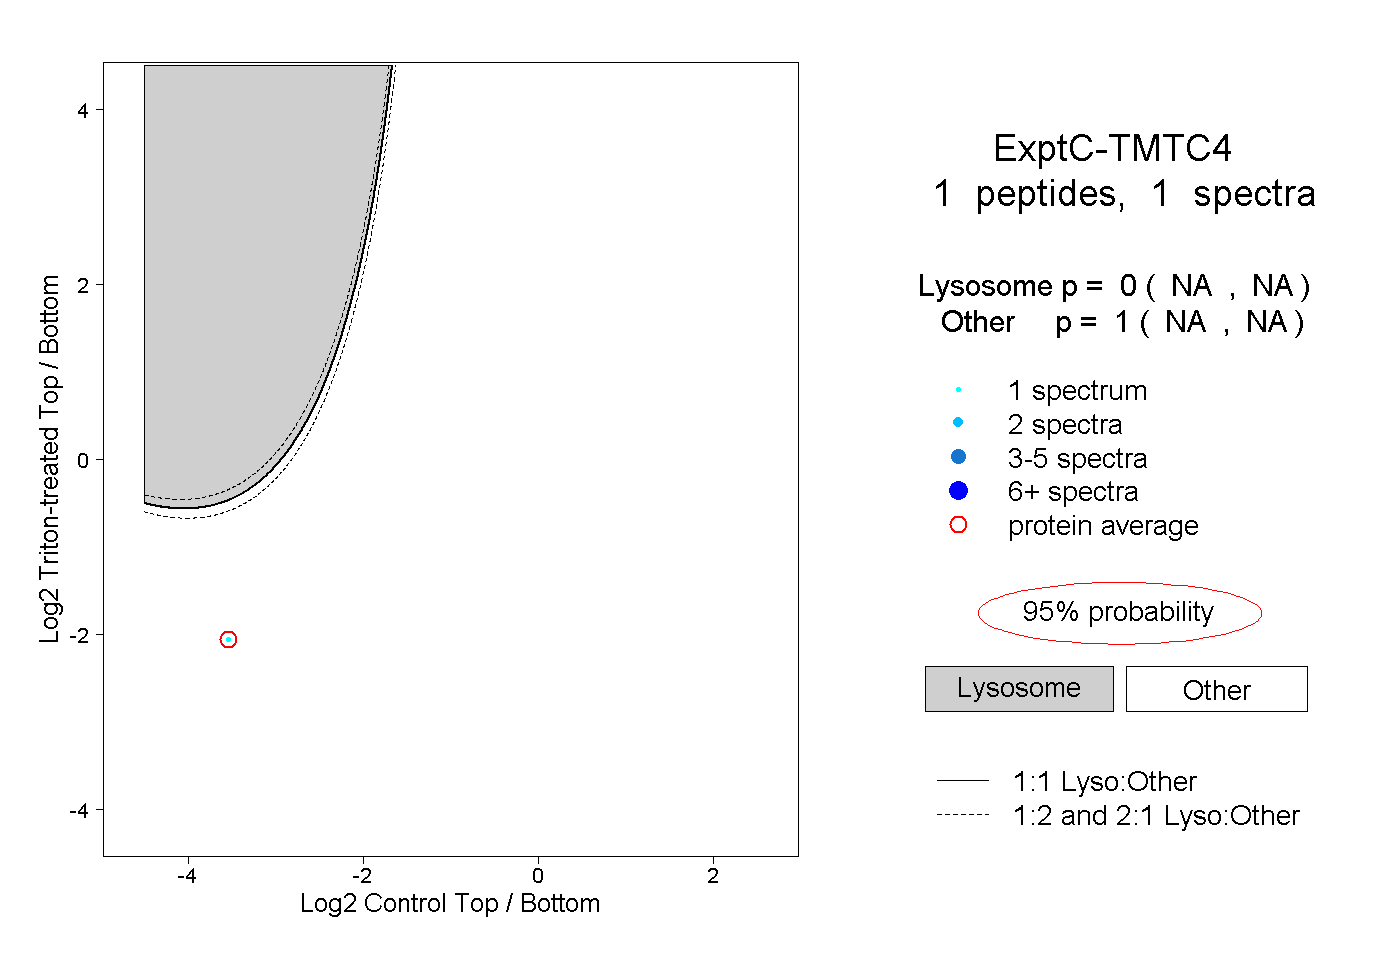
| Plot | Lyso | Other | |||||||||||
| Expt C |
1 peptide |
1 spectrum |
|
0.000 NA | NA |
1.000 NA | NA |