8
8peptides
spectra
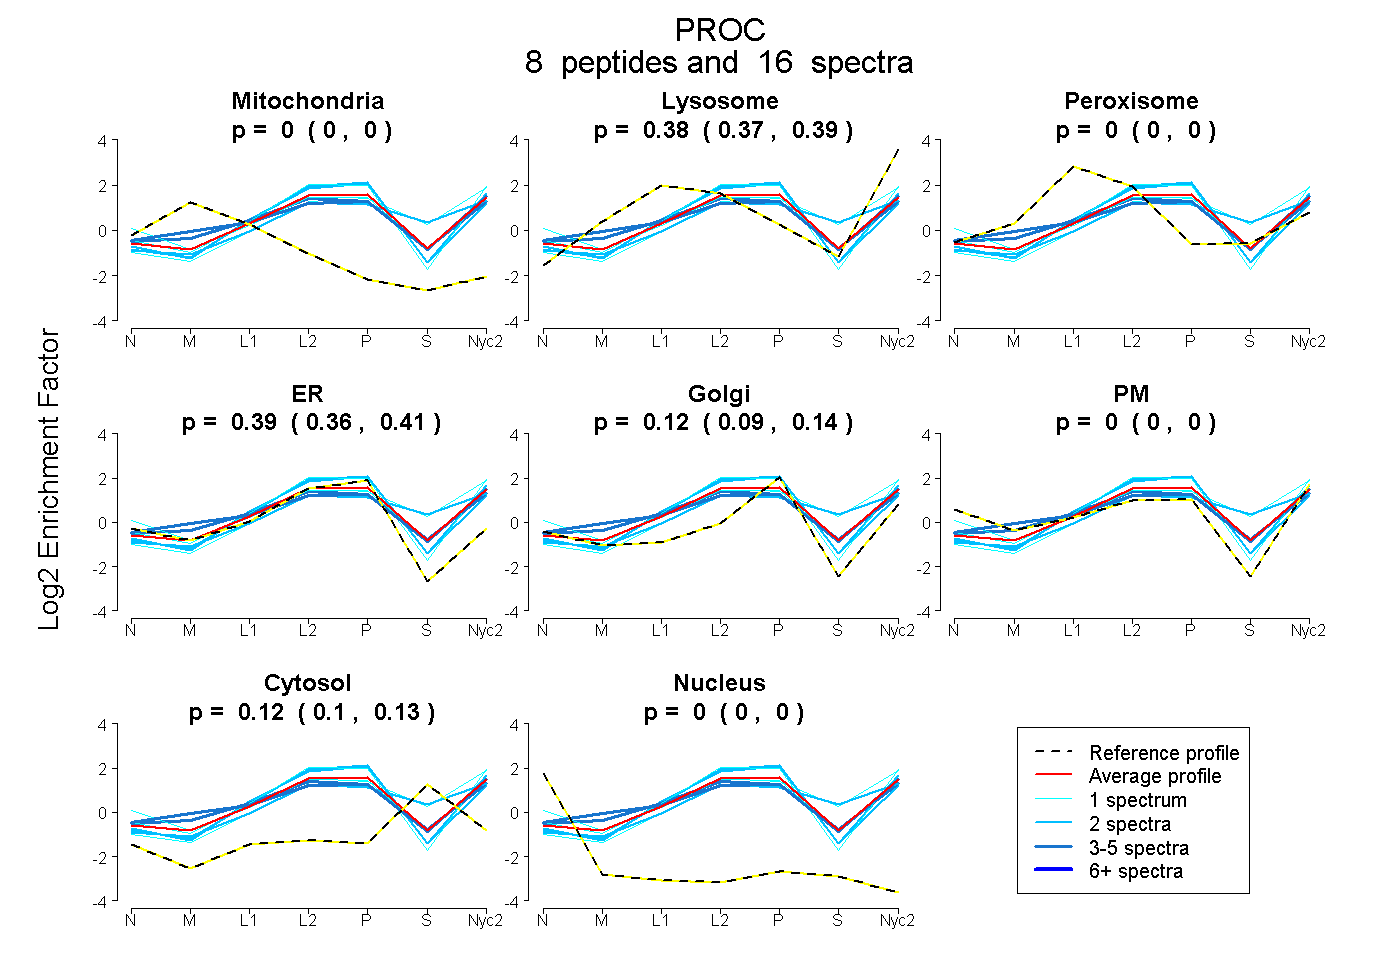
0.000 | 0.000
0.366 | 0.388
0.000 | 0.000
0.364 | 0.407
0.088 | 0.144
0.000 | 0.000
0.099 | 0.129
0.000 | 0.000
5peptides
spectra
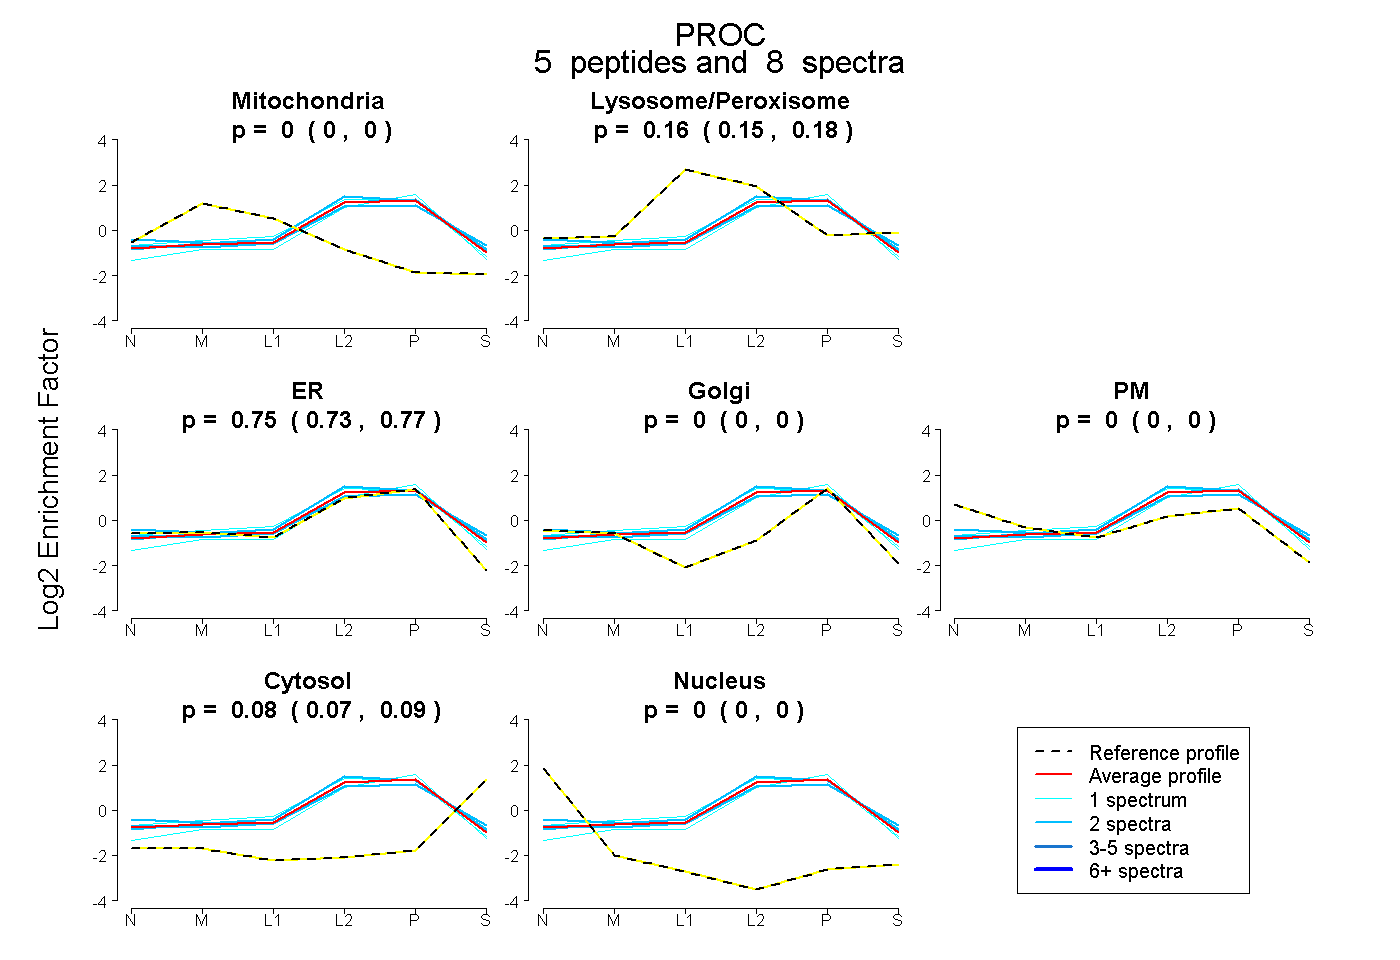
0.000 | 0.000
0.149 | 0.176
0.734 | 0.766
0.000 | 0.000
0.000 | 0.000
0.073 | 0.093
0.000 | 0.000