 8
8peptides
spectra
0.000 | 0.000
0.366 | 0.388
0.000 | 0.000
0.364 | 0.407
0.088 | 0.144
0.000 | 0.000
0.099 | 0.129
0.000 | 0.000
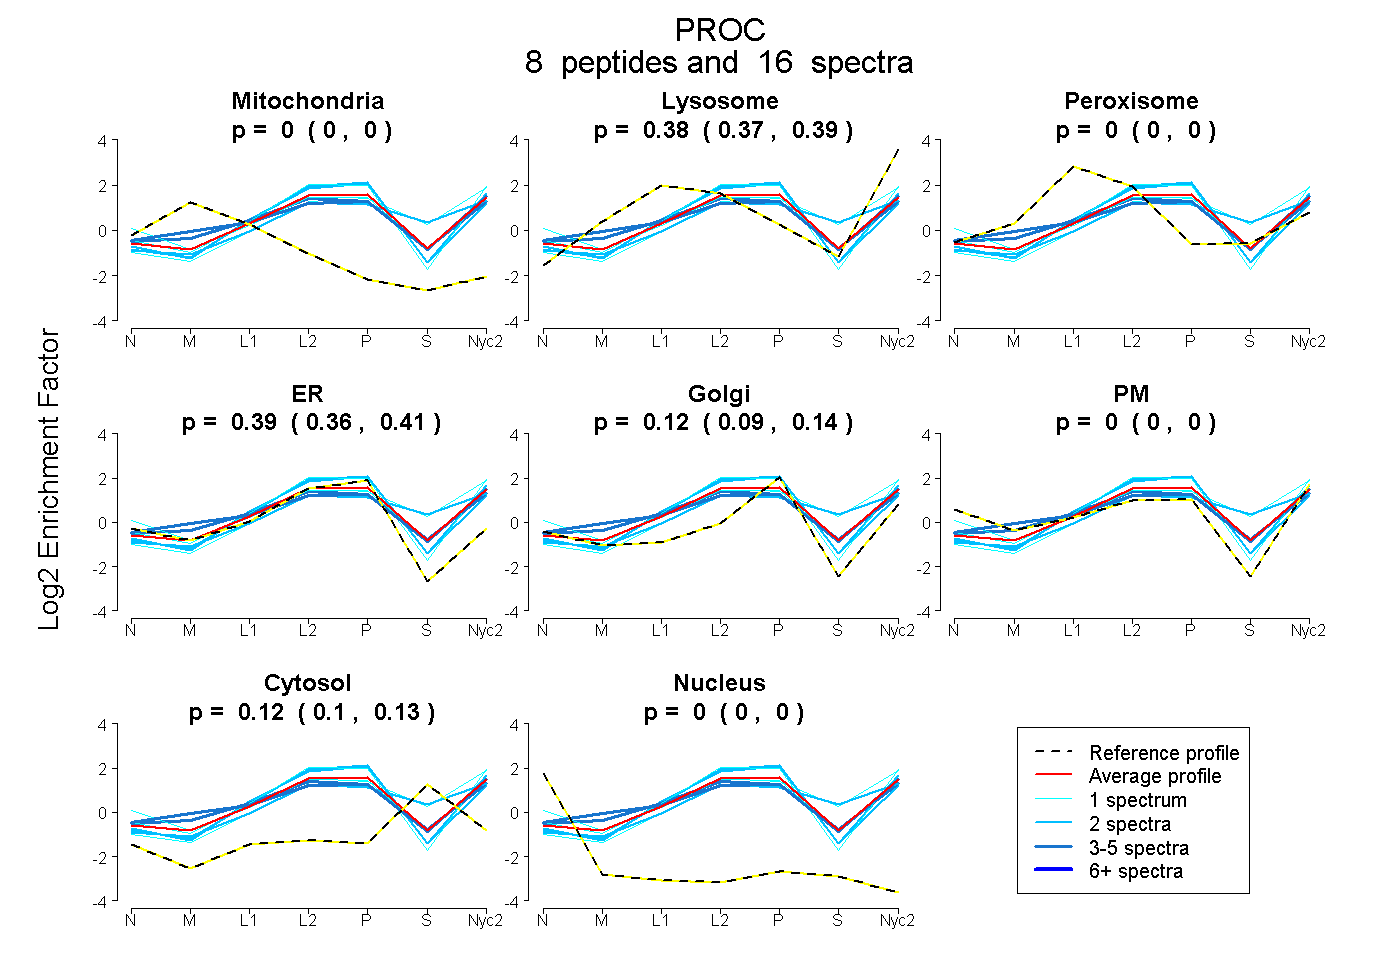
| Plot | Mito | Lyso | Perox | ER | Golgi | PM | Cytosol | Nucleus | |||||
| Expt A |
8 peptides |
16 spectra |
|
0.000 0.000 | 0.000 |
0.378 0.366 | 0.388 |
0.000 0.000 | 0.000 |
0.389 0.364 | 0.407 |
0.118 0.088 | 0.144 |
0.000 0.000 | 0.000 |
0.115 0.099 | 0.129 |
0.000 0.000 | 0.000 |
| 3 spectra, LSQPATLSK | 0.000 | 0.356 | 0.018 | 0.387 | 0.000 | 0.102 | 0.137 | 0.000 | ||
| 2 spectra, VGSYLK | 0.000 | 0.391 | 0.000 | 0.261 | 0.020 | 0.000 | 0.327 | 0.000 | ||
| 4 spectra, WIHSYIGER | 0.000 | 0.316 | 0.102 | 0.159 | 0.226 | 0.116 | 0.082 | 0.000 | ||
| 2 spectra, ANSFLEEVR | 0.000 | 0.297 | 0.000 | 0.601 | 0.074 | 0.000 | 0.028 | 0.000 | ||
| 1 spectrum, QGDSPWQAILLDSK | 0.000 | 0.220 | 0.000 | 0.233 | 0.000 | 0.421 | 0.125 | 0.000 | ||
| 1 spectrum, TFILTFIR | 0.000 | 0.353 | 0.000 | 0.437 | 0.122 | 0.087 | 0.000 | 0.000 | ||
| 1 spectrum, DPWELDLDIK | 0.000 | 0.443 | 0.000 | 0.076 | 0.216 | 0.000 | 0.265 | 0.000 | ||
| 2 spectra, IPLAAR | 0.000 | 0.362 | 0.000 | 0.476 | 0.162 | 0.000 | 0.000 | 0.000 |
| Plot | Mito | Lyso or Perox | ER | Golgi | PM | Cytosol | Nucleus | ||||||
| Expt B |
5 peptides |
8 spectra |
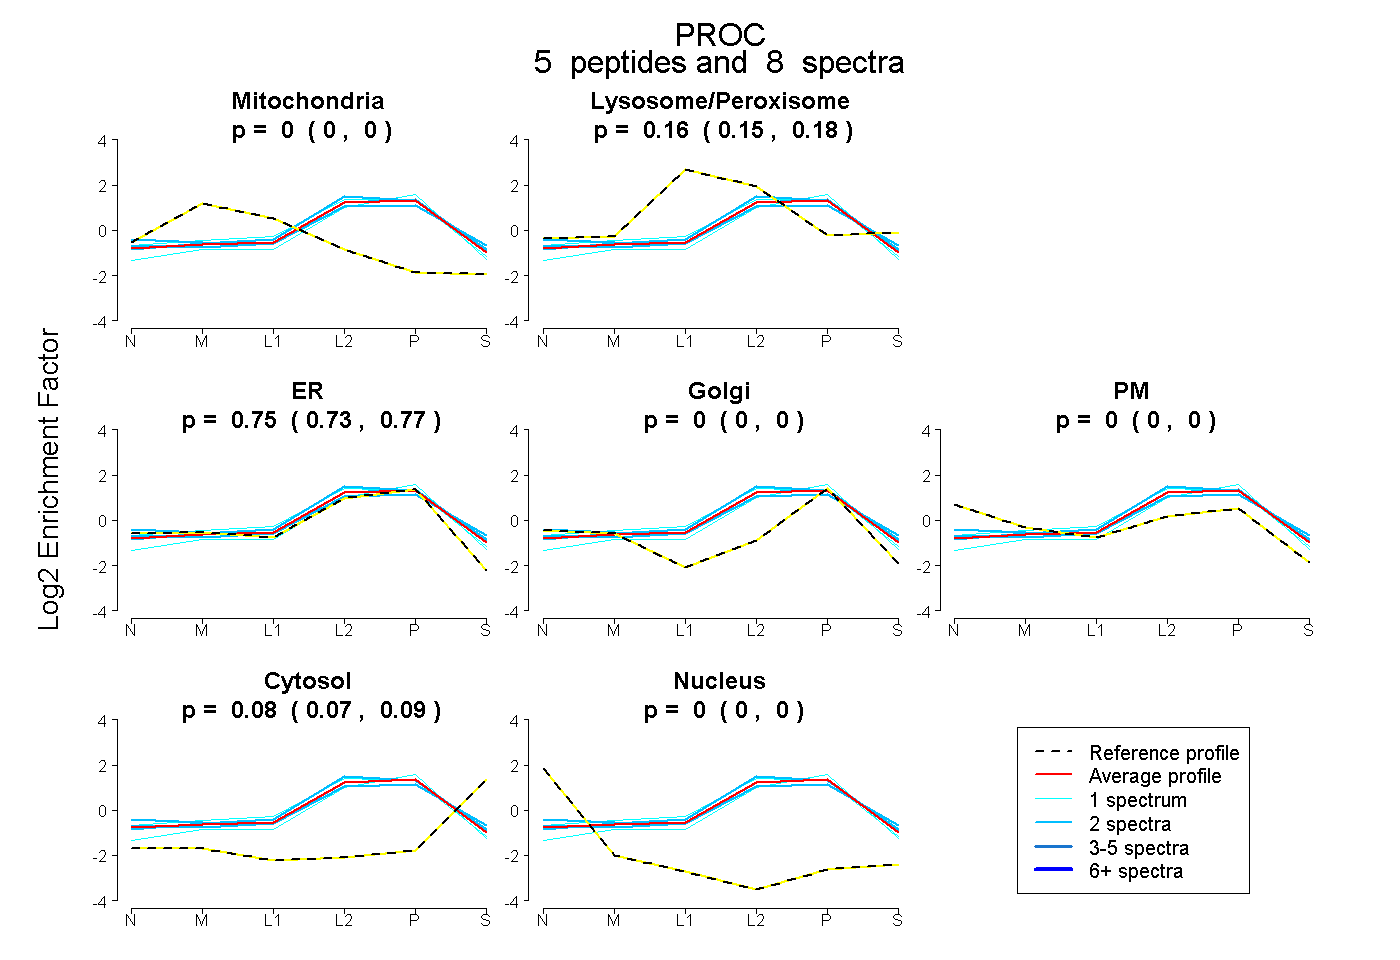 |
0.000 0.000 | 0.000 |
0.164 0.149 | 0.176 |
0.752 0.734 | 0.766 |
0.000 0.000 | 0.000 |
0.000 0.000 | 0.000 |
0.084 0.073 | 0.093 |
0.000 0.000 | 0.000 |
|||
| Plot | Lyso | Other | |||||||||||
| Expt C |
7 peptides |
36 spectra |
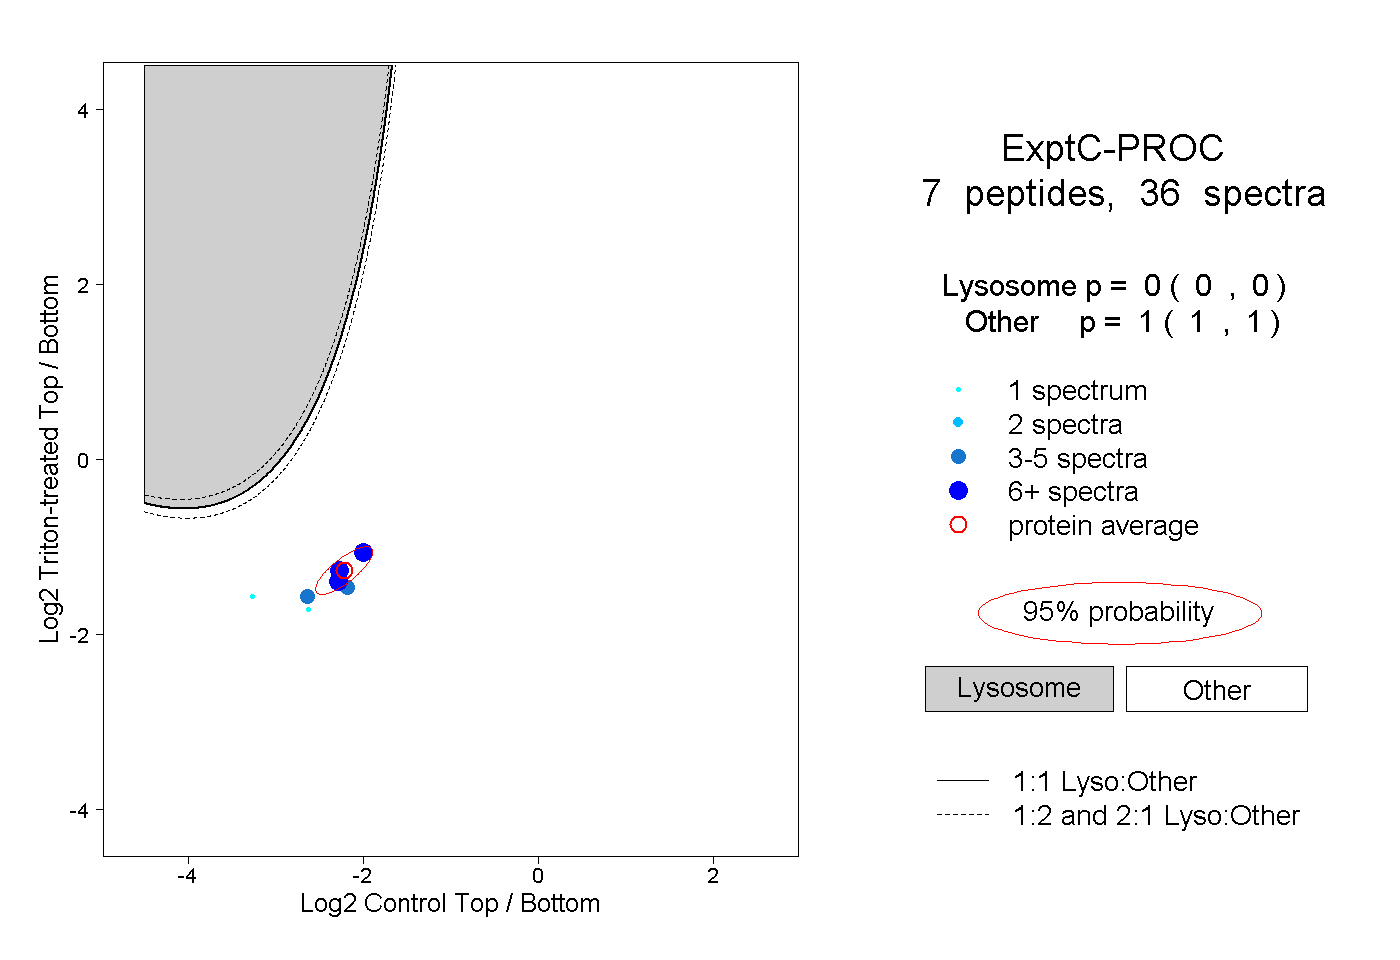 |
0.000 0.000 | 0.000 |
1.000 1.000 | 1.000 |
||||||||
| Plot | Lyso | Other | |||||||||||
| Expt D |
5 peptides |
7 spectra |
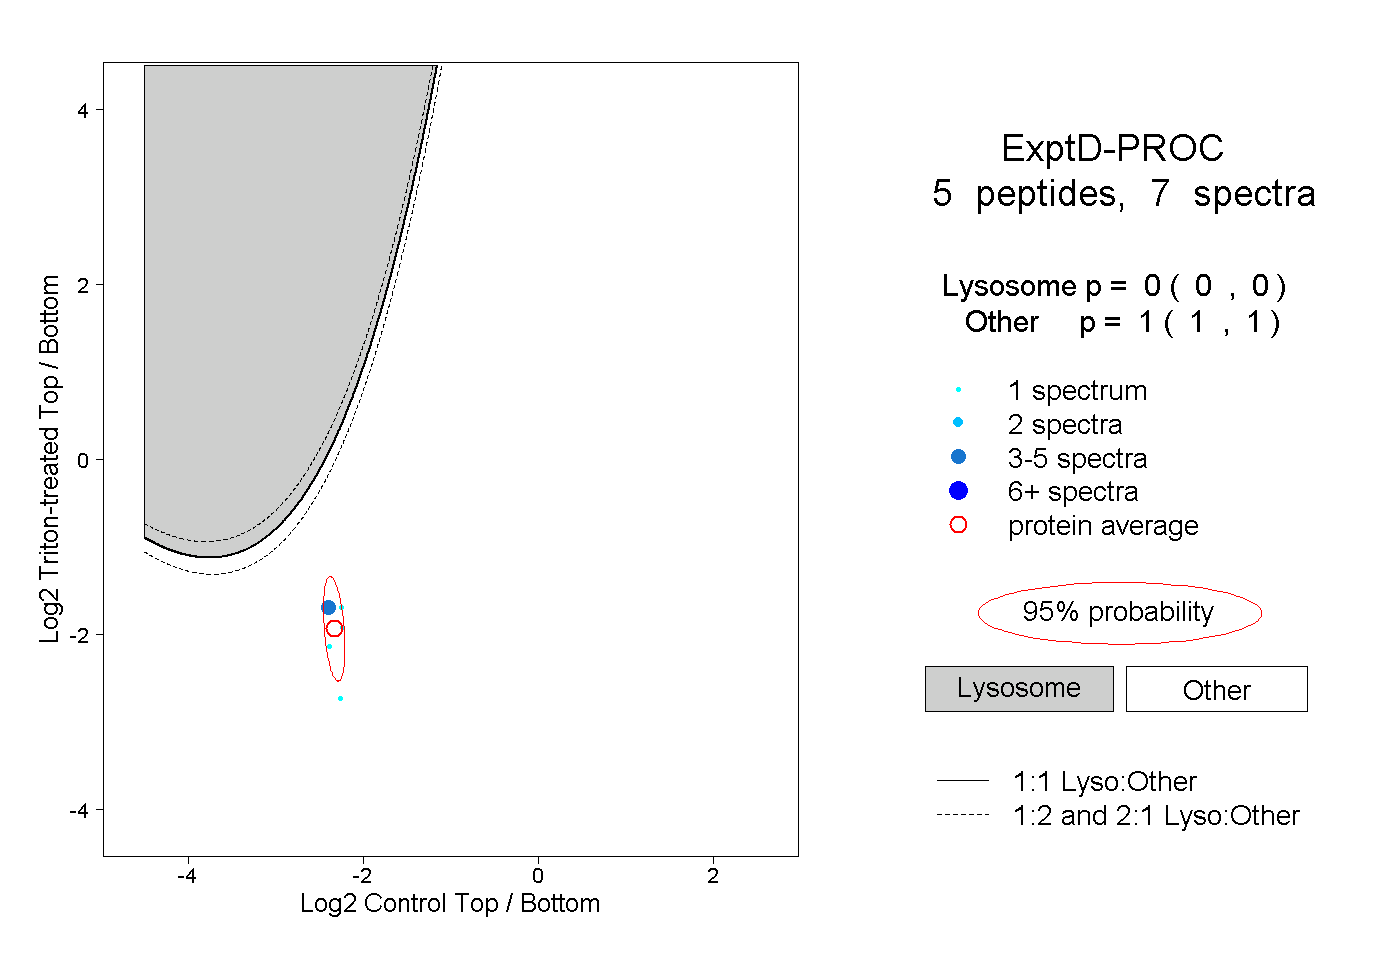 |
0.000 0.000 | 0.000 |
1.000 1.000 | 1.000 |