 3
3peptides
spectra
0.000 | 0.132
0.069 | 0.205
0.000 | 0.090
0.000 | 0.000
0.000 | 0.052
0.000 | 0.078
0.639 | 0.830
0.000 | 0.000
1peptide
spectra
NA | NA
NA | NA
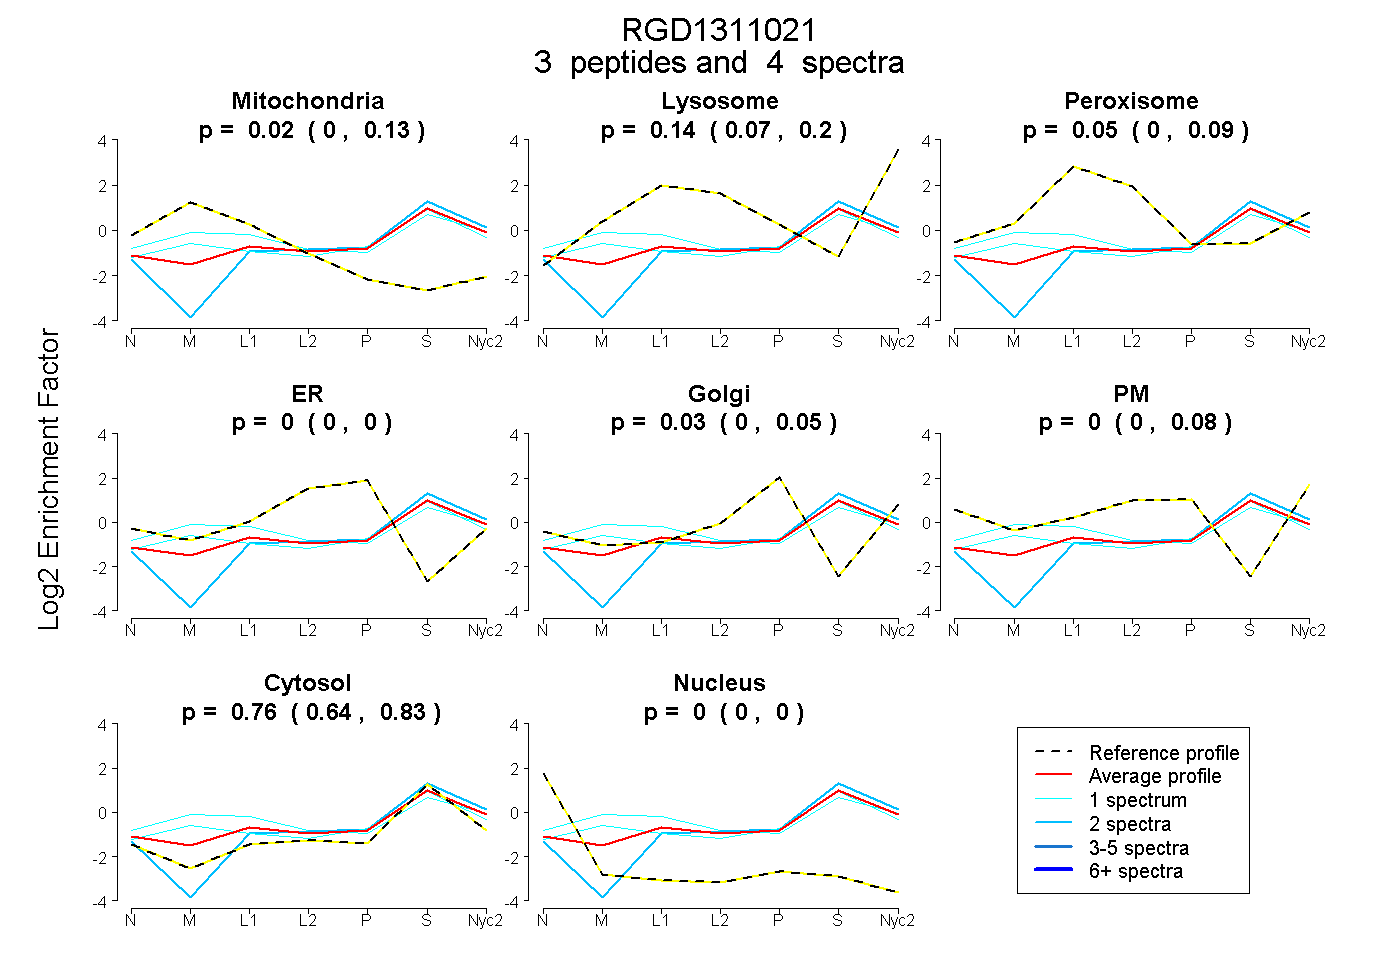
| Plot | Mito | Lyso | Perox | ER | Golgi | PM | Cytosol | Nucleus | |||||
| Expt A |
3 peptides |
4 spectra |
|
0.024 0.000 | 0.132 |
0.139 0.069 | 0.205 |
0.046 0.000 | 0.090 |
0.000 0.000 | 0.000 |
0.029 0.000 | 0.052 |
0.003 0.000 | 0.078 |
0.760 0.639 | 0.830 |
0.000 0.000 | 0.000 |
||
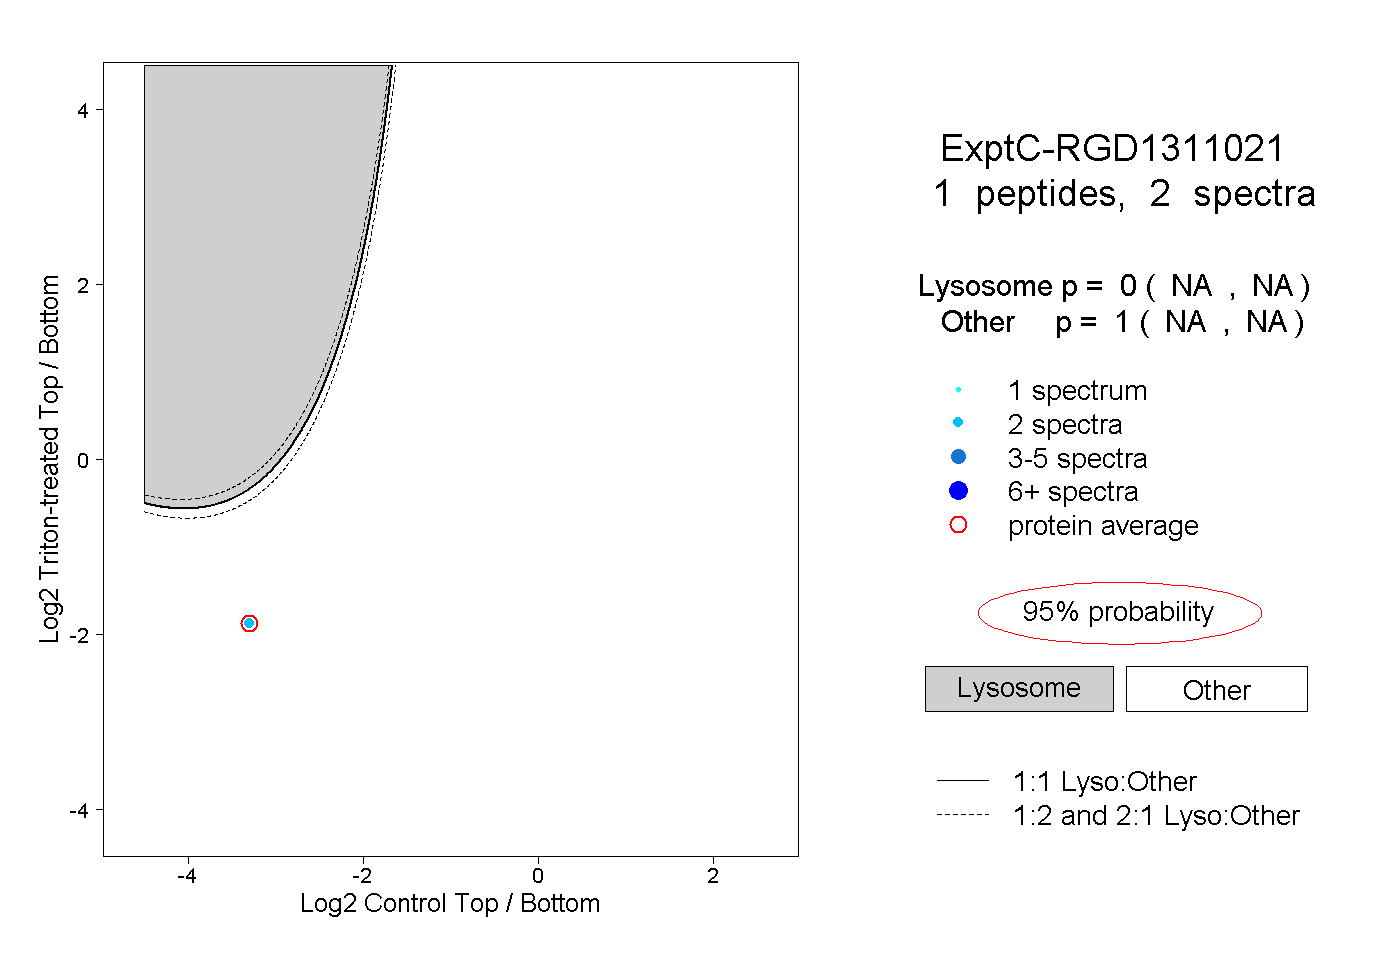
| Plot | Lyso | Other | |||||||||||
| Expt C |
1 peptide |
2 spectra |
|
0.000 NA | NA |
1.000 NA | NA |