 1
1peptide
spectrum
NA | NA
NA | NA
NA | NA
NA | NA
NA | NA
NA | NA
NA | NA
NA | NA
2peptides
spectra
NA | NA
NA | NA
NA | NA
NA | NA
NA | NA
NA | NA
NA | NA
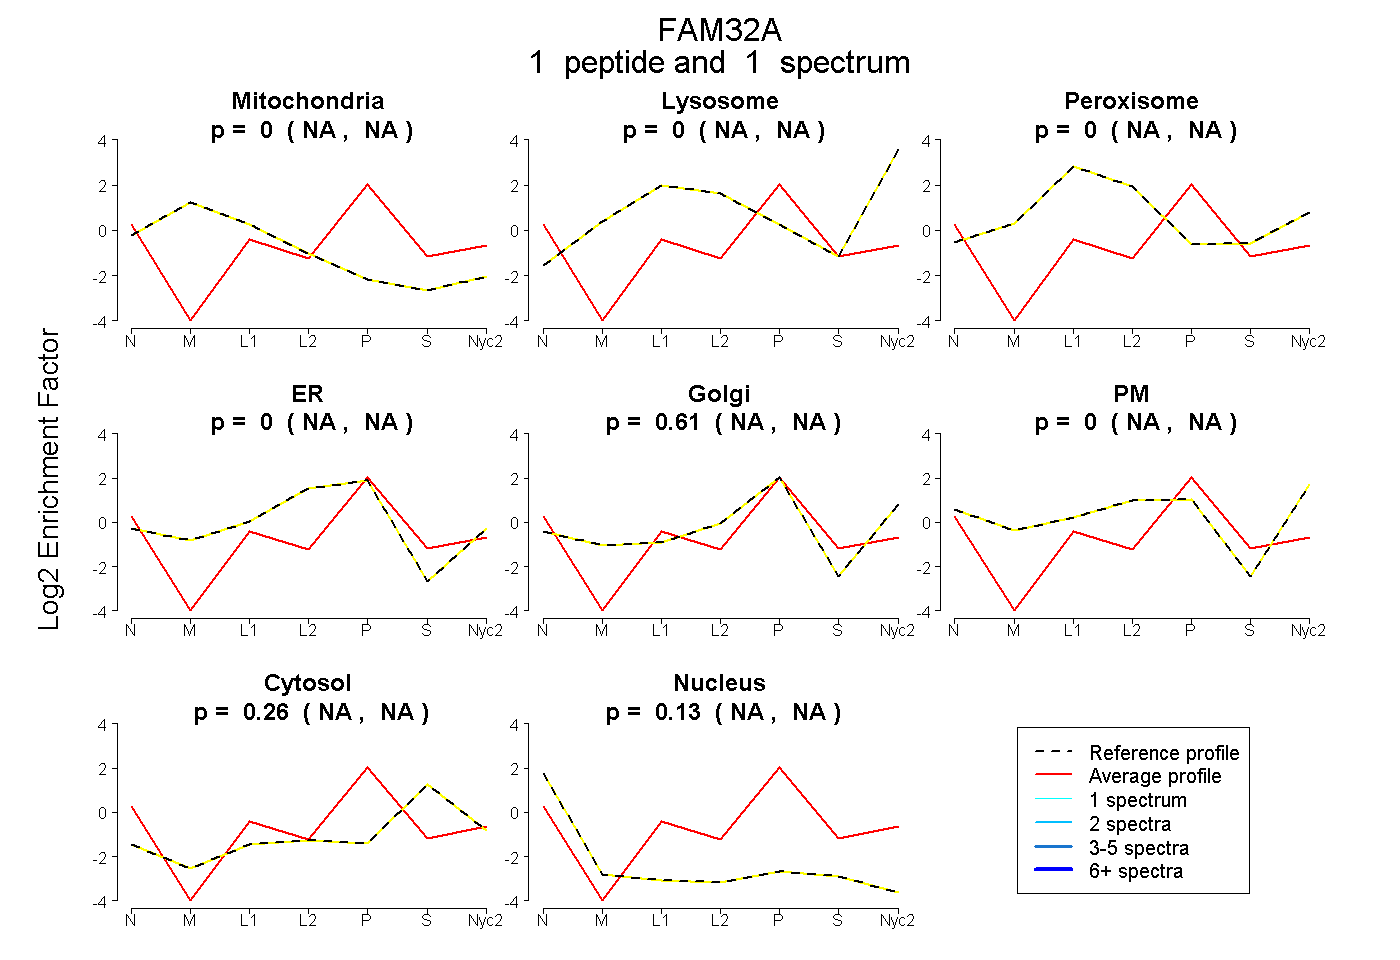
| Plot | Mito | Lyso | Perox | ER | Golgi | PM | Cytosol | Nucleus | |||||
| Expt A |
1 peptide |
1 spectrum |
|
0.000 NA | NA |
0.000 NA | NA |
0.000 NA | NA |
0.000 NA | NA |
0.614 NA | NA |
0.000 NA | NA |
0.258 NA | NA |
0.128 NA | NA |
||
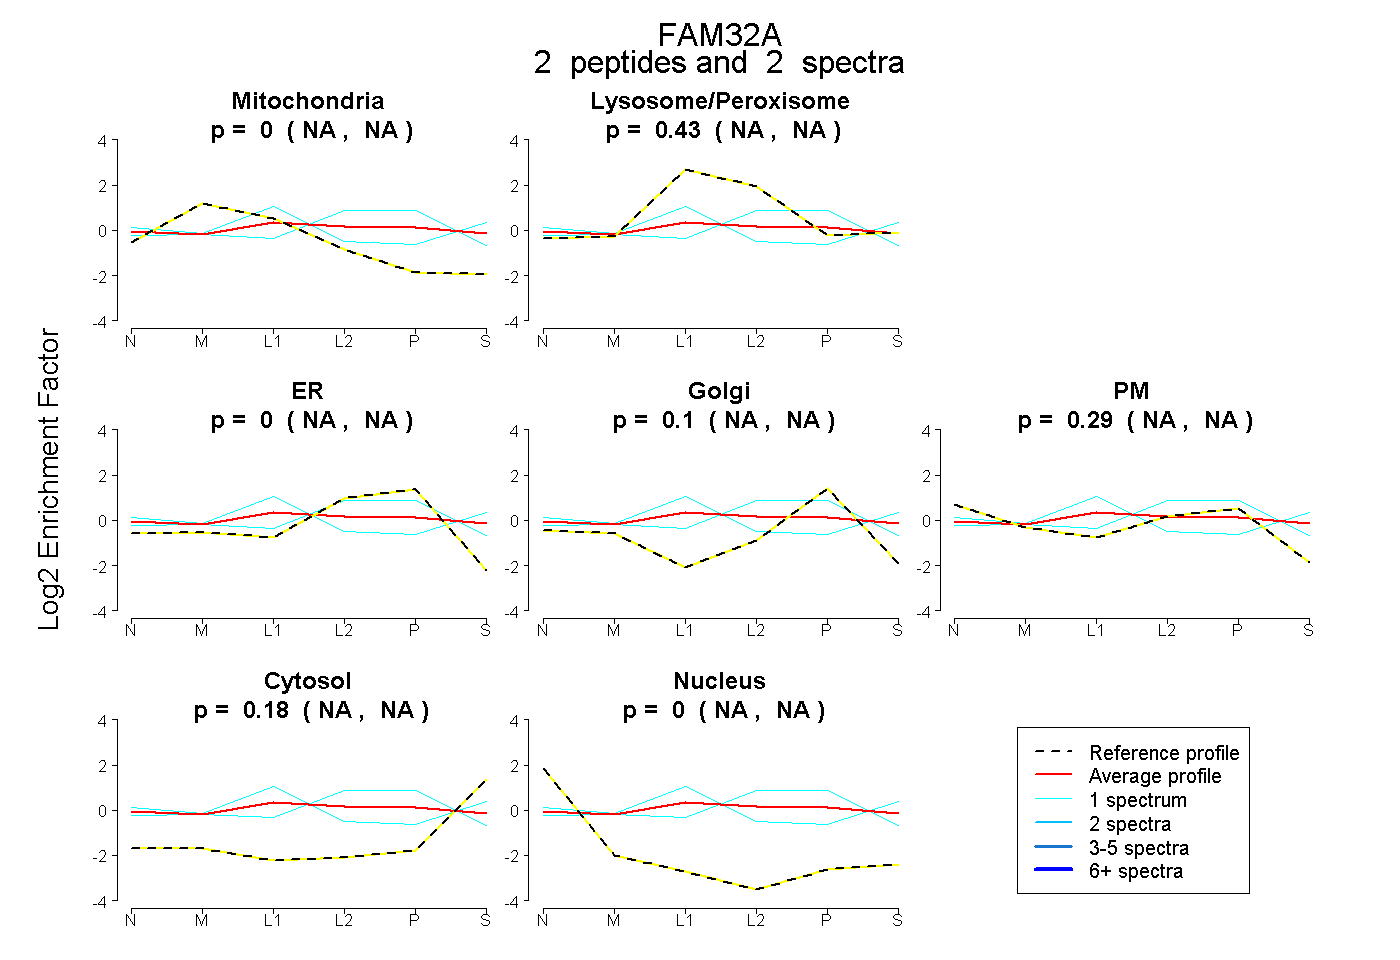
| Plot | Mito | Lyso or Perox | ER | Golgi | PM | Cytosol | Nucleus | ||||||
| Expt B |
2 peptides |
2 spectra |
|
0.000 NA | NA |
0.426 NA | NA |
0.000 NA | NA |
0.096 NA | NA |
0.294 NA | NA |
0.183 NA | NA |
0.000 NA | NA |
| 1 spectrum, GVAELGVTK | 0.000 | 0.352 | 0.223 | 0.310 | 0.069 | 0.046 | 0.000 | |||
| 1 spectrum, TPAQAAFEK | 0.114 | 0.552 | 0.000 | 0.000 | 0.000 | 0.225 | 0.109 |