 3
3peptides
spectra
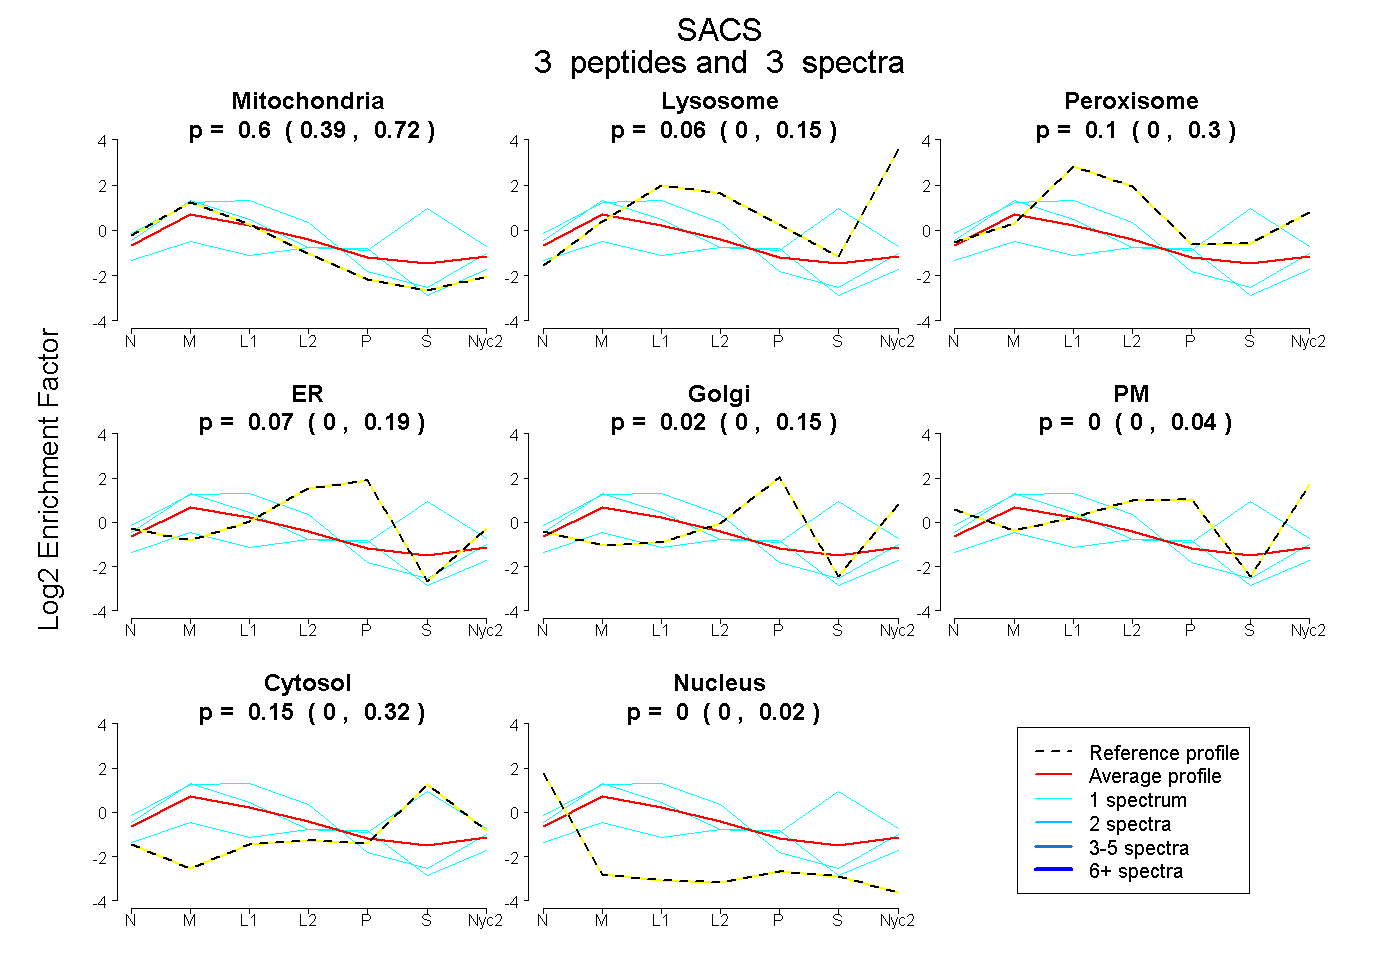
0.394 | 0.723
0.000 | 0.145
0.000 | 0.304
0.000 | 0.186
0.000 | 0.150
0.000 | 0.038
0.000 | 0.315
0.000 | 0.018
| Plot | Mito | Lyso | Perox | ER | Golgi | PM | Cytosol | Nucleus | |||||
| Expt A |
3 peptides |
3 spectra |
|
0.596 0.394 | 0.723 |
0.063 0.000 | 0.145 |
0.101 0.000 | 0.304 |
0.069 0.000 | 0.186 |
0.017 0.000 | 0.150 |
0.000 0.000 | 0.038 |
0.155 0.000 | 0.315 |
0.000 0.000 | 0.018 |
| 1 spectrum, LGAIPK | 0.189 | 0.121 | 0.000 | 0.000 | 0.000 | 0.000 | 0.691 | 0.000 | ||
| 1 spectrum, AVHYMVQTSTFR | 0.663 | 0.000 | 0.334 | 0.000 | 0.000 | 0.003 | 0.000 | 0.000 | ||
| 1 spectrum, NQDITLFPR | 0.784 | 0.000 | 0.000 | 0.193 | 0.023 | 0.000 | 0.000 | 0.000 |
| Plot | Lyso | Other | |||||||||||
| Expt C |
2 peptides |
3 spectra |
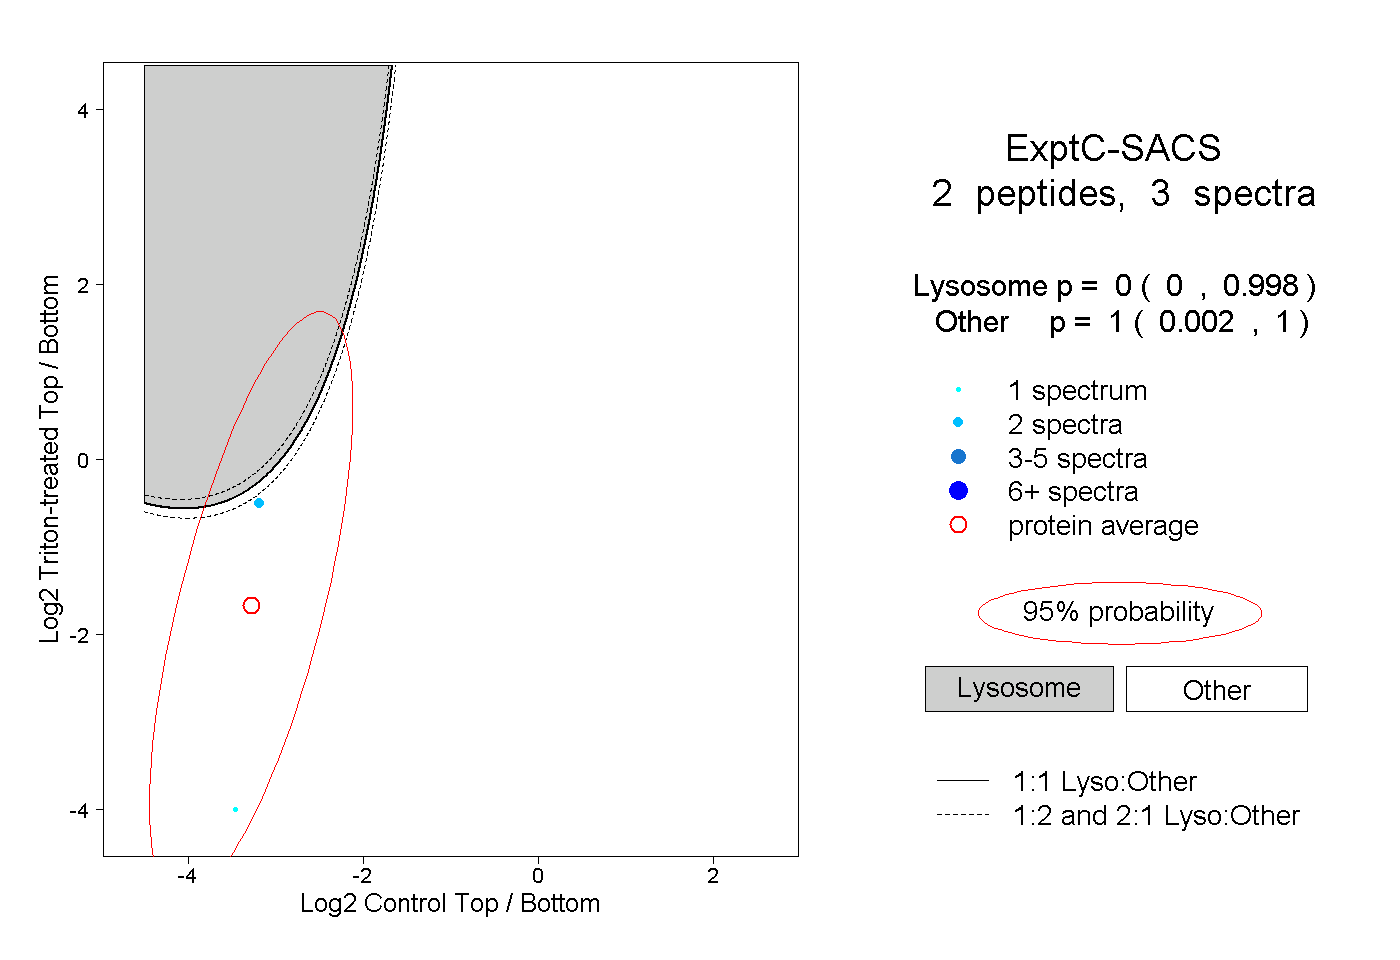 |
0.000 0.000 | 0.998 |
1.000 0.002 | 1.000 |