 5
5peptides
spectra
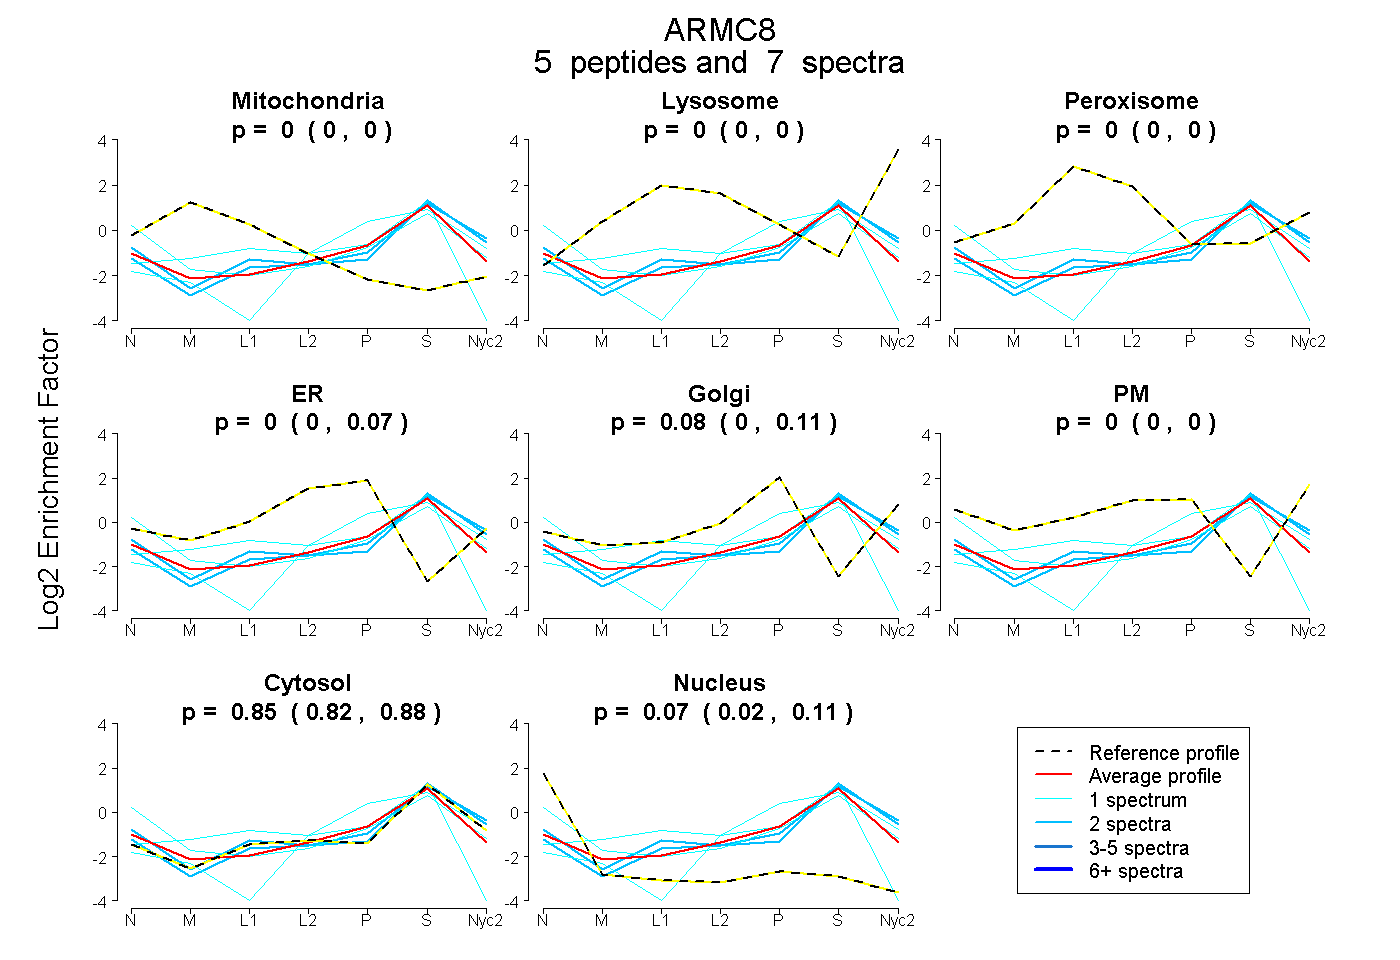
0.000 | 0.000
0.000 | 0.000
0.000 | 0.000
0.000 | 0.069
0.000 | 0.110
0.000 | 0.000
0.819 | 0.880
0.024 | 0.109
| Plot | Mito | Lyso | Perox | ER | Golgi | PM | Cytosol | Nucleus | |||||
| Expt A |
5 peptides |
7 spectra |
|
0.000 0.000 | 0.000 |
0.000 0.000 | 0.000 |
0.000 0.000 | 0.000 |
0.000 0.000 | 0.069 |
0.075 0.000 | 0.110 |
0.000 0.000 | 0.000 |
0.854 0.819 | 0.880 |
0.071 0.024 | 0.109 |
| 2 spectra, DMGIVDILHK | 0.000 | 0.000 | 0.000 | 0.000 | 0.000 | 0.000 | 0.991 | 0.009 | ||
| 1 spectrum, TLPCLVR | 0.000 | 0.000 | 0.000 | 0.000 | 0.067 | 0.066 | 0.677 | 0.190 | ||
| 1 spectrum, YPSSVSAITDIK | 0.000 | 0.000 | 0.077 | 0.013 | 0.236 | 0.000 | 0.675 | 0.000 | ||
| 1 spectrum, ELIMTNDDILQK | 0.000 | 0.000 | 0.000 | 0.000 | 0.000 | 0.000 | 0.761 | 0.239 | ||
| 2 spectra, SLSTEQLFR | 0.000 | 0.000 | 0.000 | 0.000 | 0.004 | 0.079 | 0.908 | 0.009 |
| Plot | Lyso | Other | |||||||||||
| Expt C |
2 peptides |
3 spectra |
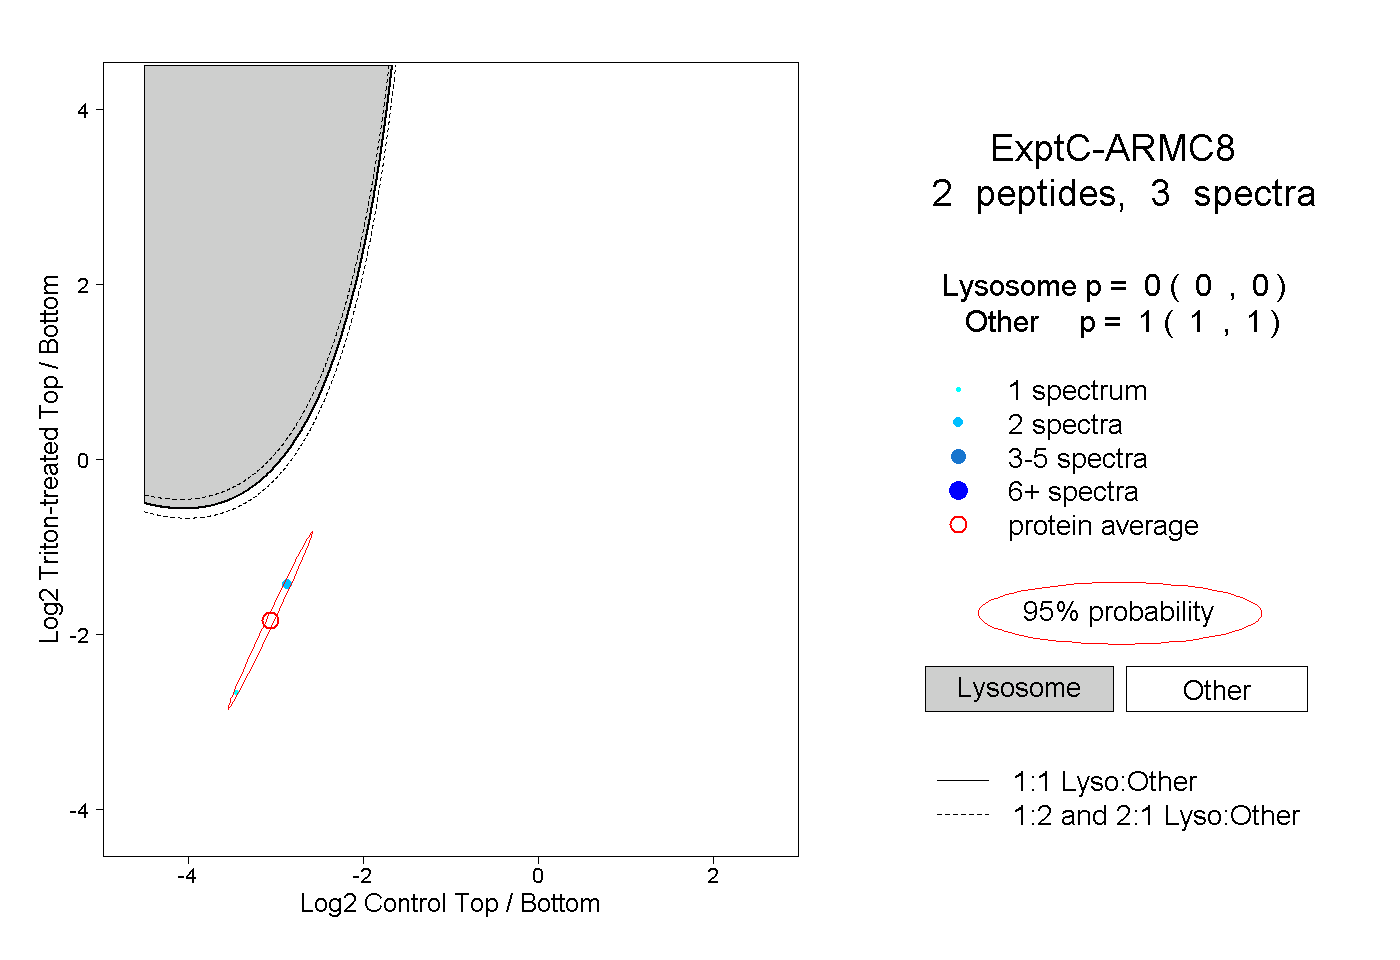 |
0.000 0.000 | 0.000 |
1.000 1.000 | 1.000 |