11
11peptides
spectra
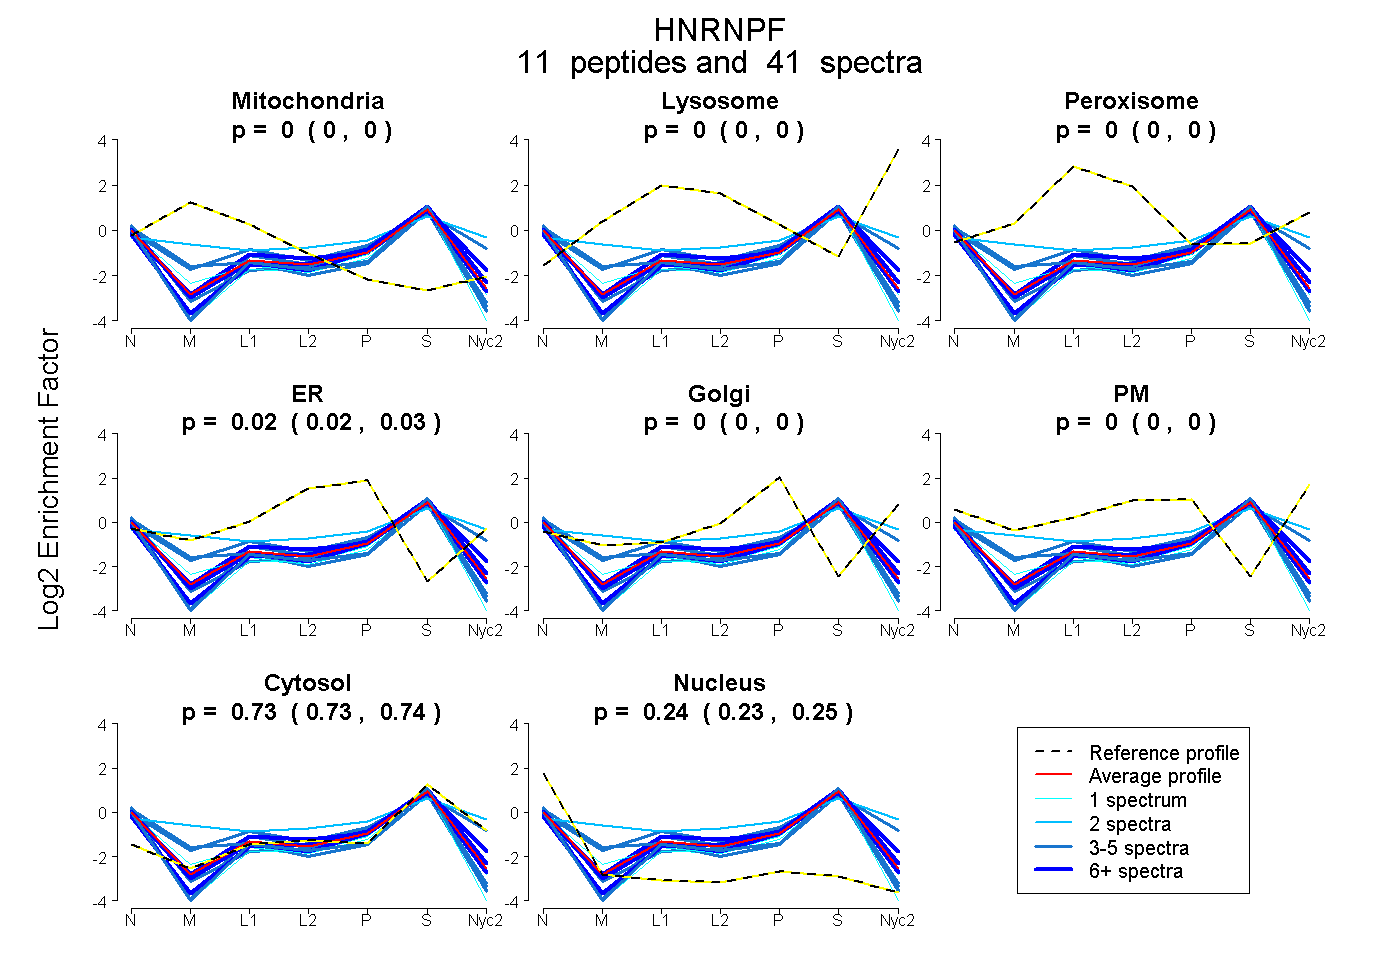
0.000 | 0.000
0.000 | 0.000
0.000 | 0.000
0.018 | 0.029
0.000 | 0.000
0.000 | 0.000
0.728 | 0.740
0.234 | 0.248
7peptides
spectra
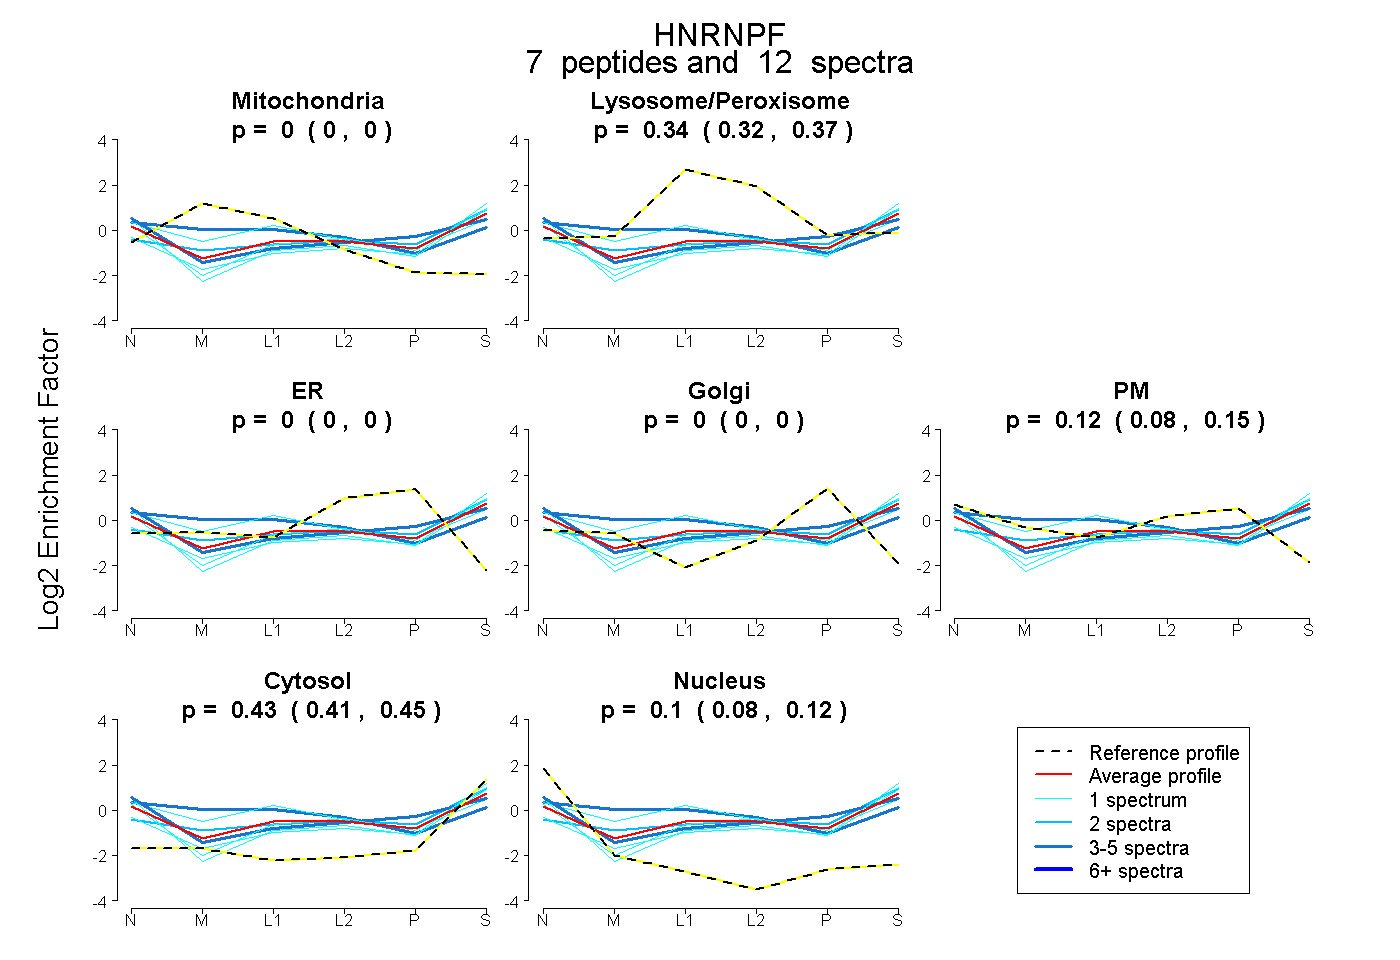
0.000 | 0.000
0.319 | 0.367
0.000 | 0.000
0.000 | 0.000
0.085 | 0.154
0.410 | 0.447
0.080 | 0.123