 11
11peptides
spectra
0.000 | 0.000
0.000 | 0.000
0.000 | 0.000
0.018 | 0.029
0.000 | 0.000
0.000 | 0.000
0.728 | 0.740
0.234 | 0.248
| Plot | Mito | Lyso | Perox | ER | Golgi | PM | Cytosol | Nucleus | |||||
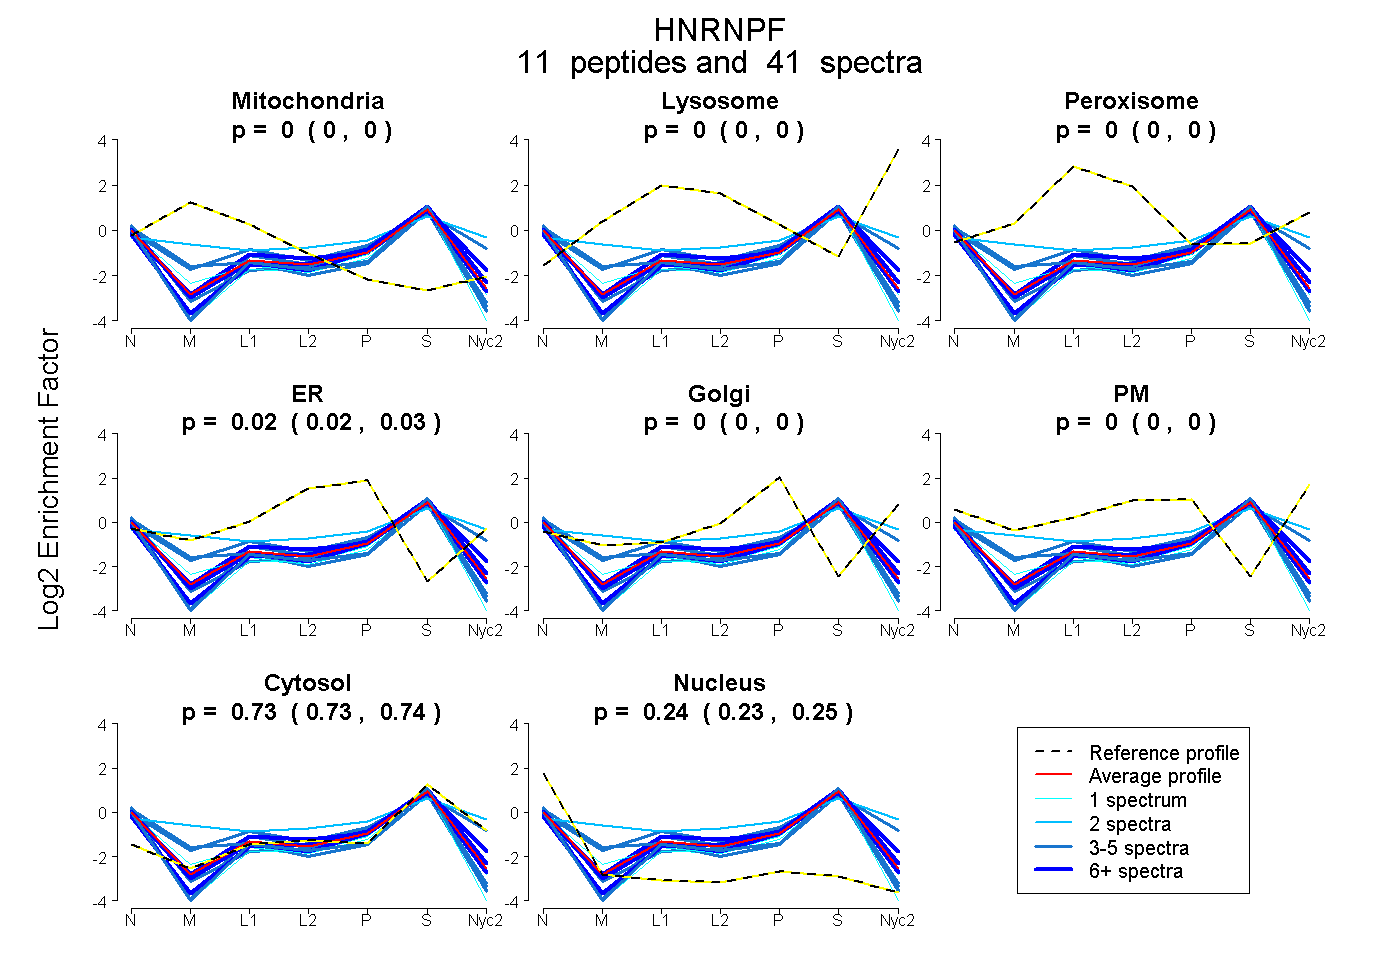
| Expt A |
11 peptides |
41 spectra |
|
0.000 0.000 | 0.000 |
0.000 0.000 | 0.000 |
0.000 0.000 | 0.000 |
0.023 0.018 | 0.029 |
0.000 0.000 | 0.000 |
0.000 0.000 | 0.000 |
0.735 0.728 | 0.740 |
0.242 0.234 | 0.248 |
| 3 spectra, DLSYCLSGMYDHR | 0.000 | 0.000 | 0.088 | 0.000 | 0.000 | 0.132 | 0.674 | 0.106 | ||
| 1 spectrum, SYSDPPLK | 0.000 | 0.000 | 0.000 | 0.000 | 0.000 | 0.000 | 0.642 | 0.358 | ||
| 5 spectra, FMSVQRPGPYDRPGTAR | 0.000 | 0.000 | 0.000 | 0.000 | 0.000 | 0.000 | 0.698 | 0.302 | ||
| 4 spectra, GLPFGCTK | 0.000 | 0.000 | 0.000 | 0.000 | 0.000 | 0.000 | 0.669 | 0.331 | ||
| 3 spectra, YIGIVK | 0.000 | 0.000 | 0.000 | 0.000 | 0.000 | 0.000 | 0.669 | 0.331 | ||
| 3 spectra, SSQEEVR | 0.114 | 0.000 | 0.000 | 0.000 | 0.000 | 0.000 | 0.577 | 0.308 | ||
| 1 spectrum, QAGLDR | 0.000 | 0.000 | 0.000 | 0.000 | 0.000 | 0.000 | 0.698 | 0.302 | ||
| 7 spectra, YIEVFK | 0.000 | 0.000 | 0.000 | 0.000 | 0.000 | 0.000 | 0.788 | 0.212 | ||
| 6 spectra, TEMDWVLK | 0.000 | 0.000 | 0.000 | 0.000 | 0.000 | 0.000 | 0.726 | 0.274 | ||
| 2 spectra, YGDSEFTVQSTTGHCVHMR | 0.109 | 0.000 | 0.055 | 0.000 | 0.000 | 0.236 | 0.600 | 0.000 | ||
| 6 spectra, HSGPNSADSANDGFVR | 0.000 | 0.000 | 0.039 | 0.036 | 0.000 | 0.000 | 0.758 | 0.167 |
| Plot | Mito | Lyso or Perox | ER | Golgi | PM | Cytosol | Nucleus | ||||||
| Expt B |
7 peptides |
12 spectra |
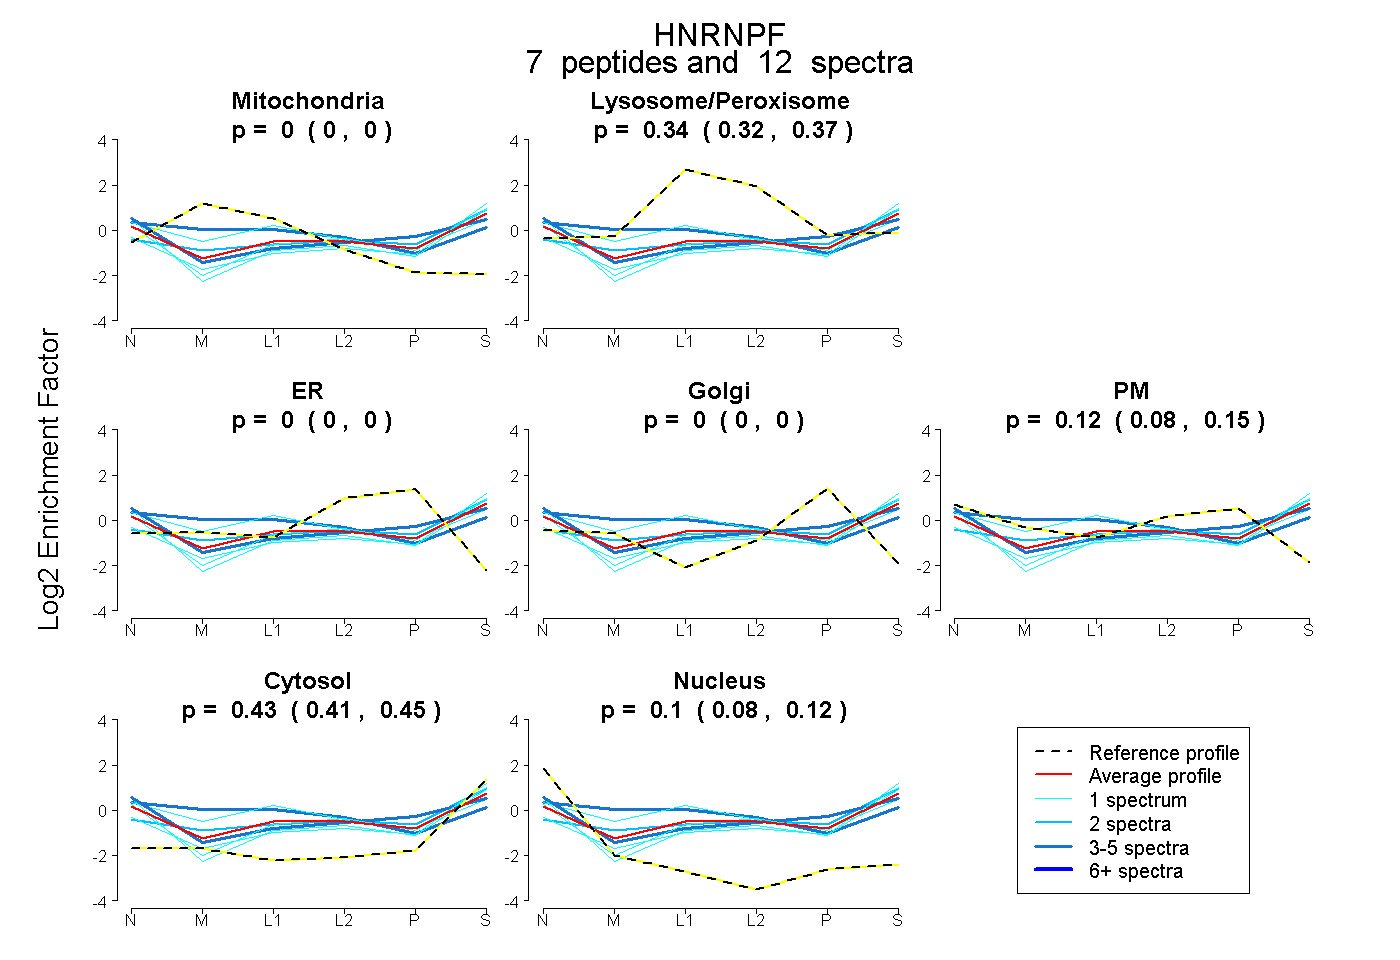 |
0.000 0.000 | 0.000 |
0.344 0.319 | 0.367 |
0.000 0.000 | 0.000 |
0.000 0.000 | 0.000 |
0.122 0.085 | 0.154 |
0.430 0.410 | 0.447 |
0.104 0.080 | 0.123 |
|||
| Plot | Lyso | Other | |||||||||||
| Expt C |
10 peptides |
48 spectra |
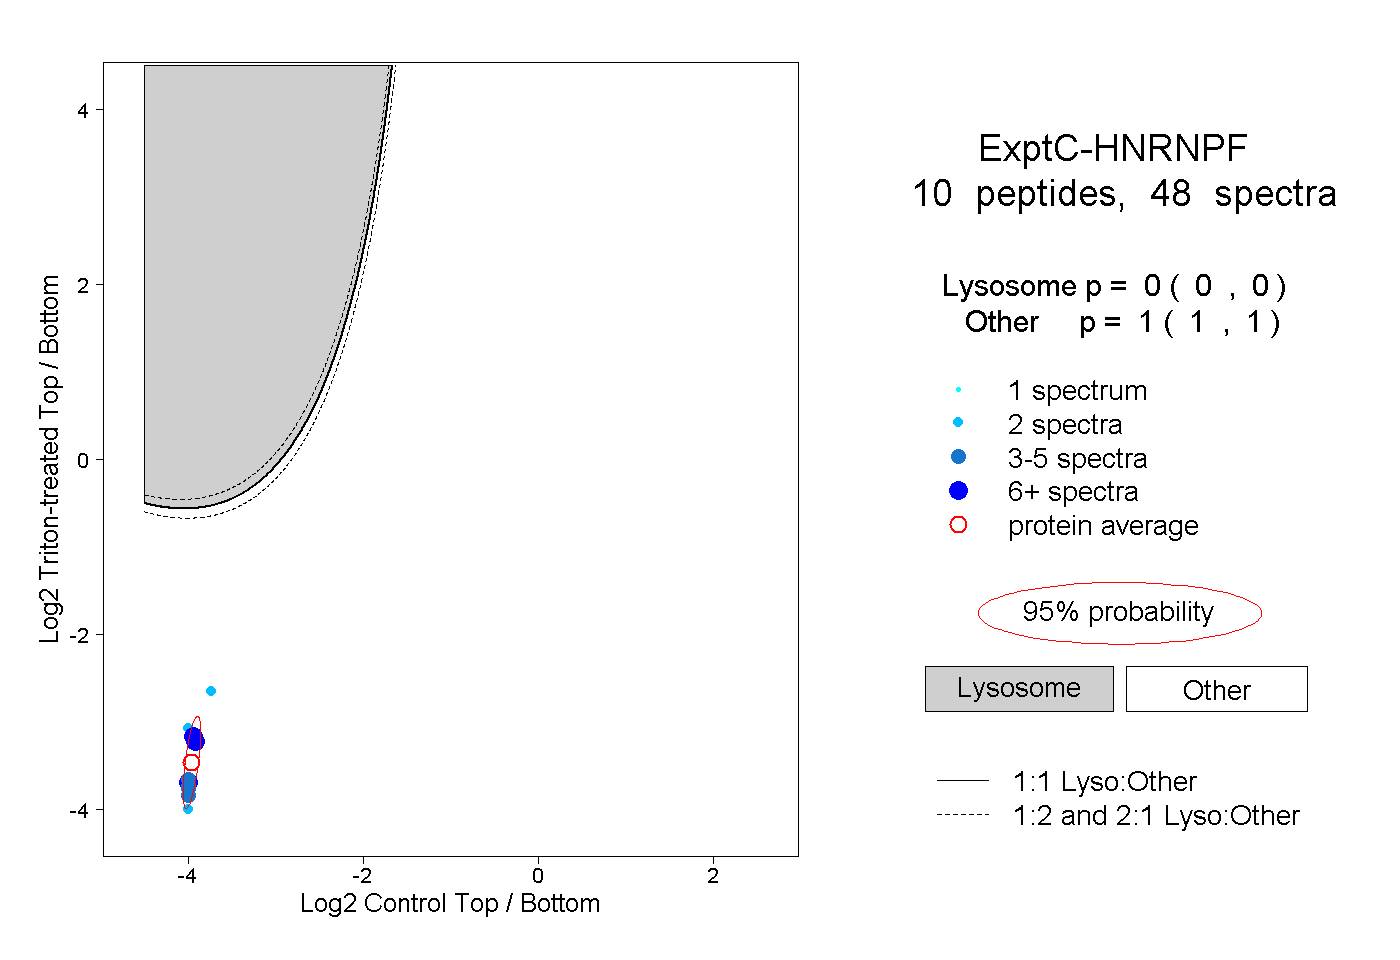 |
0.000 0.000 | 0.000 |
1.000 1.000 | 1.000 |
||||||||
| Plot | Lyso | Other | |||||||||||
| Expt D |
4 peptides |
7 spectra |
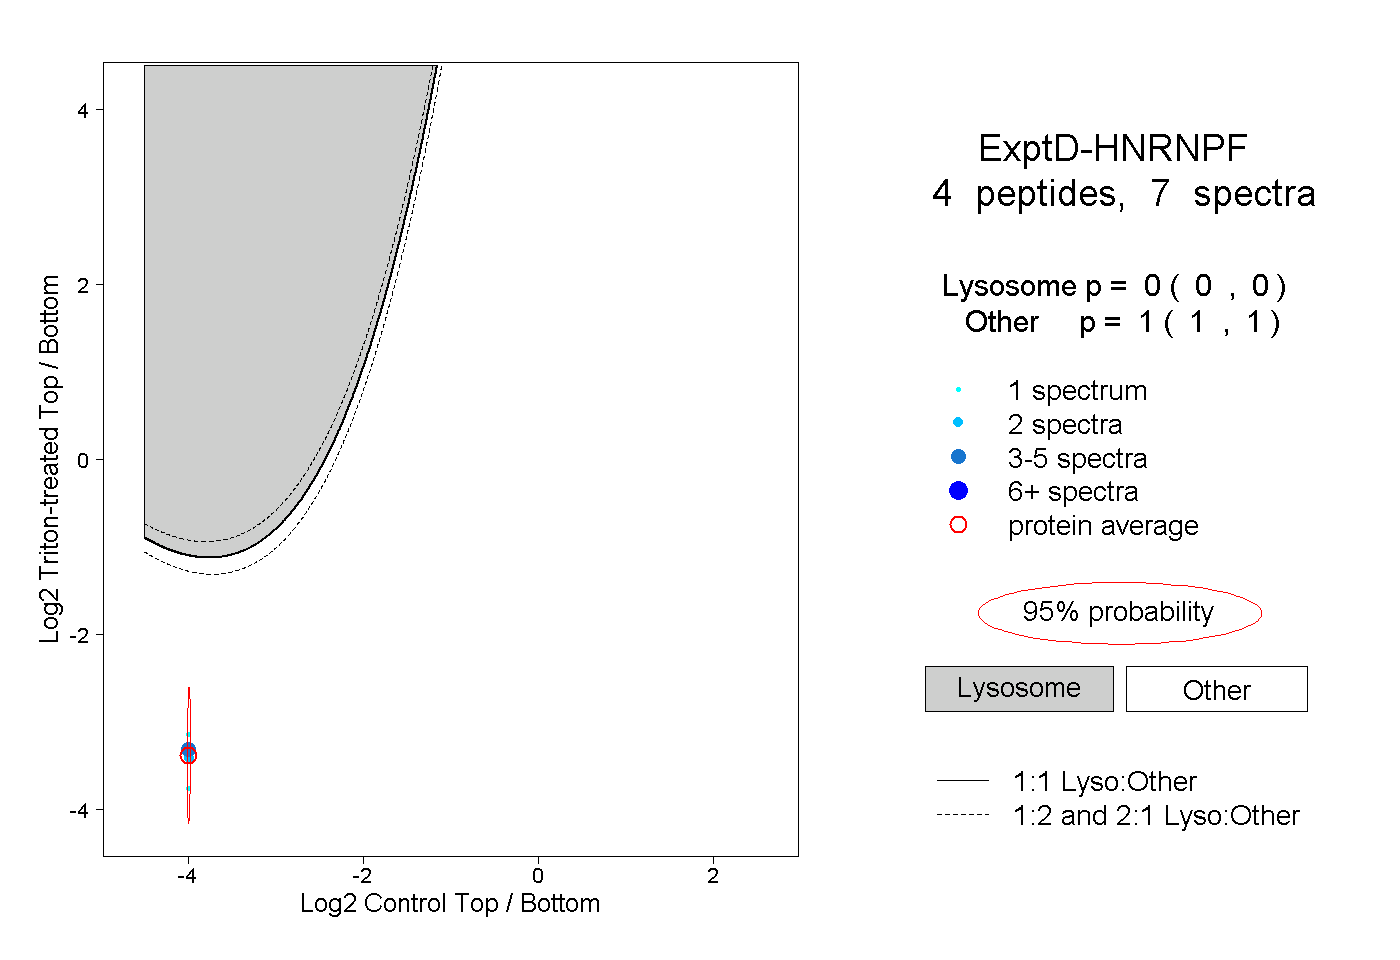 |
0.000 0.000 | 0.000 |
1.000 1.000 | 1.000 |