4
4peptides
spectra
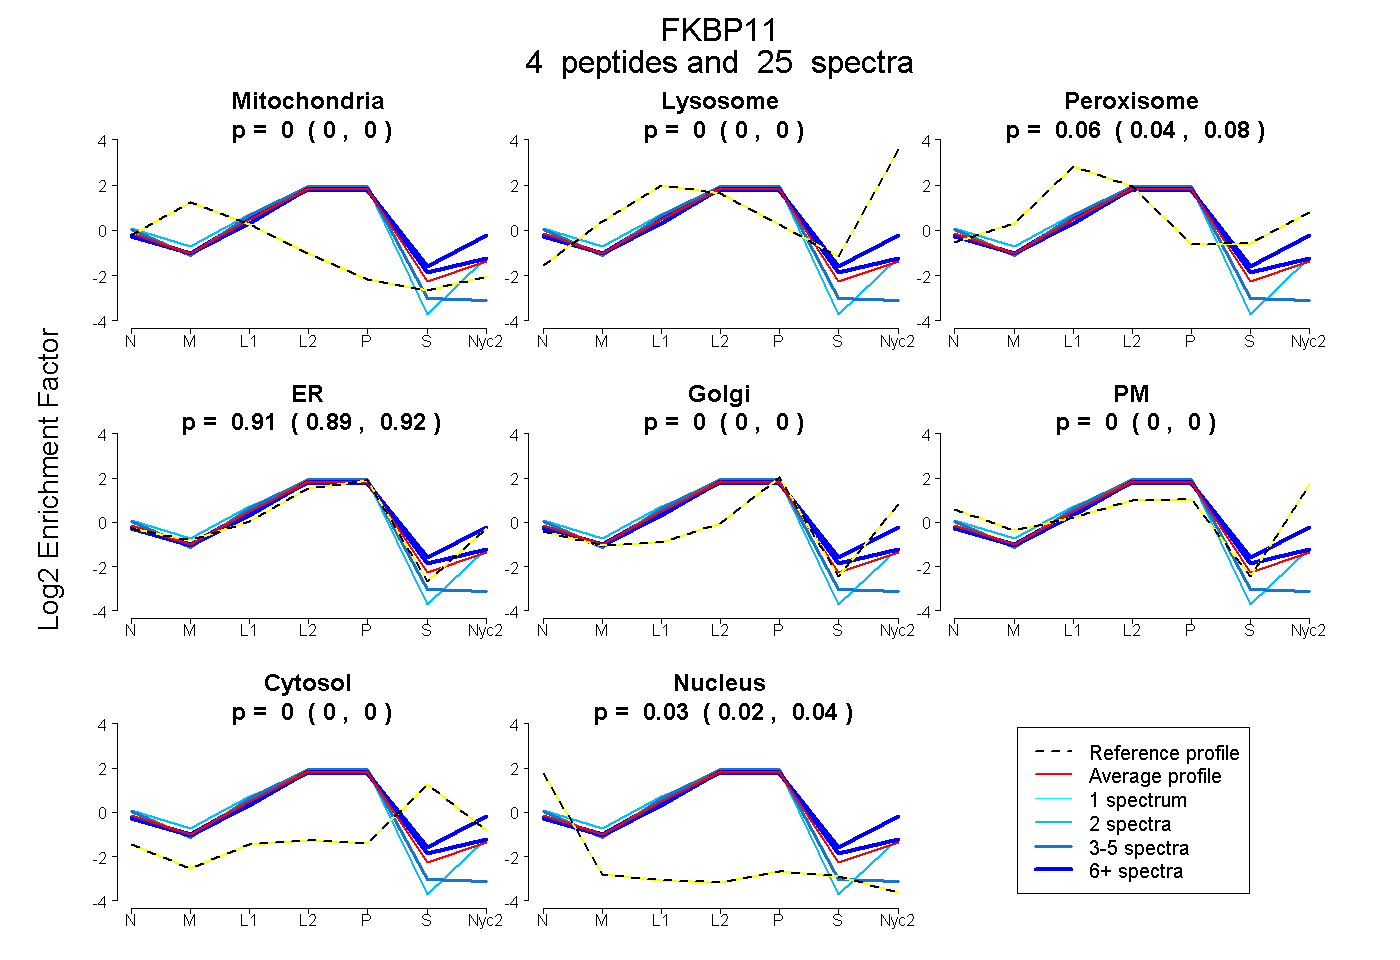
0.000 | 0.000
0.000 | 0.000
0.039 | 0.077
0.888 | 0.922
0.000 | 0.000
0.000 | 0.000
0.000 | 0.000
0.021 | 0.042
4peptides
spectra
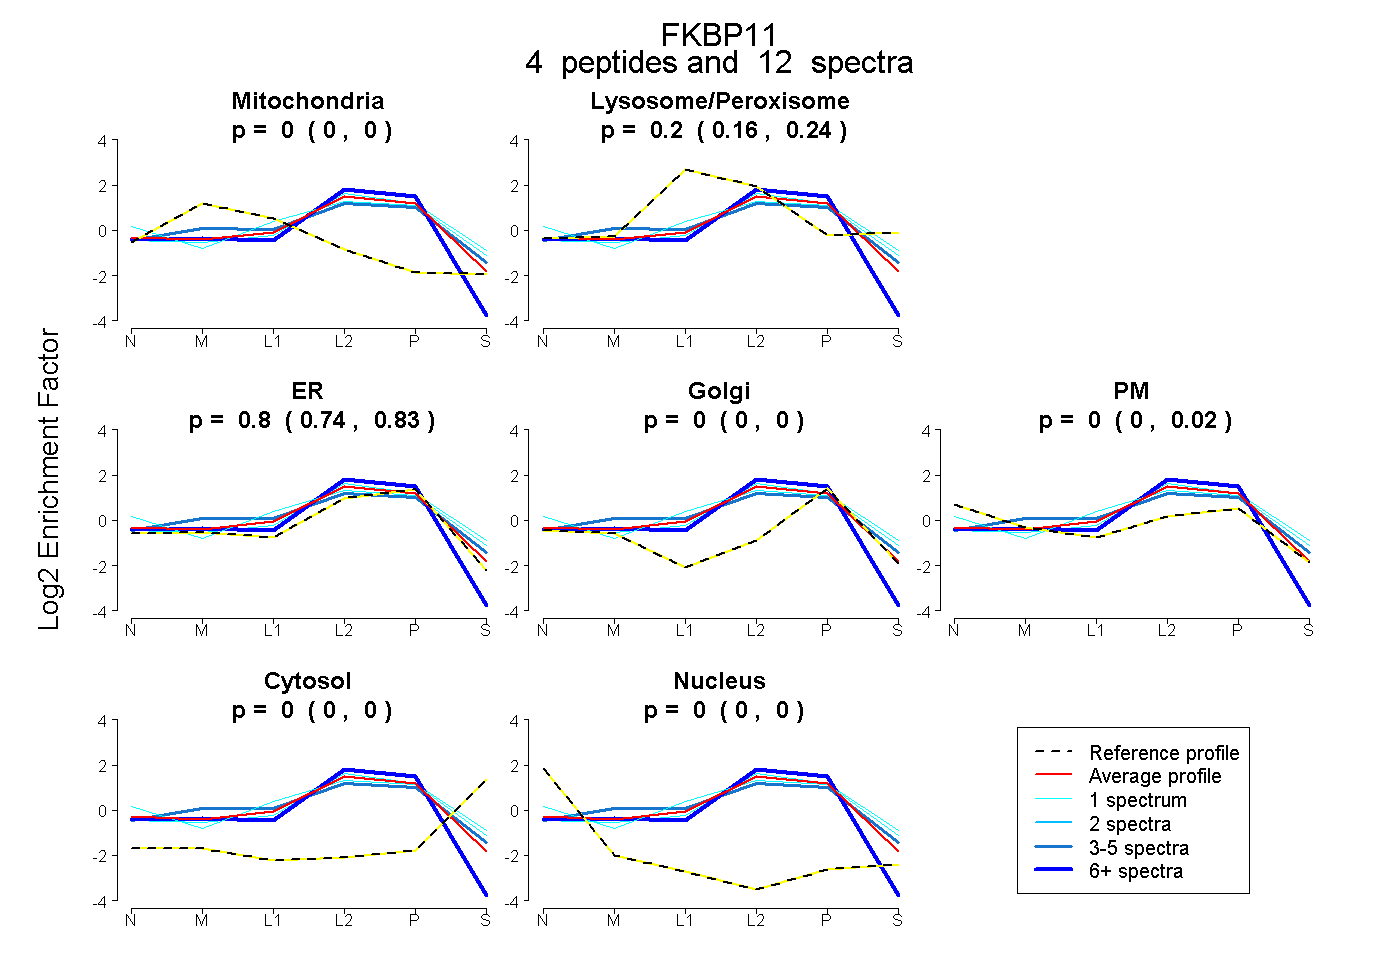
0.000 | 0.000
0.160 | 0.240
0.744 | 0.832
0.000 | 0.000
0.000 | 0.019
0.000 | 0.000
0.000 | 0.000
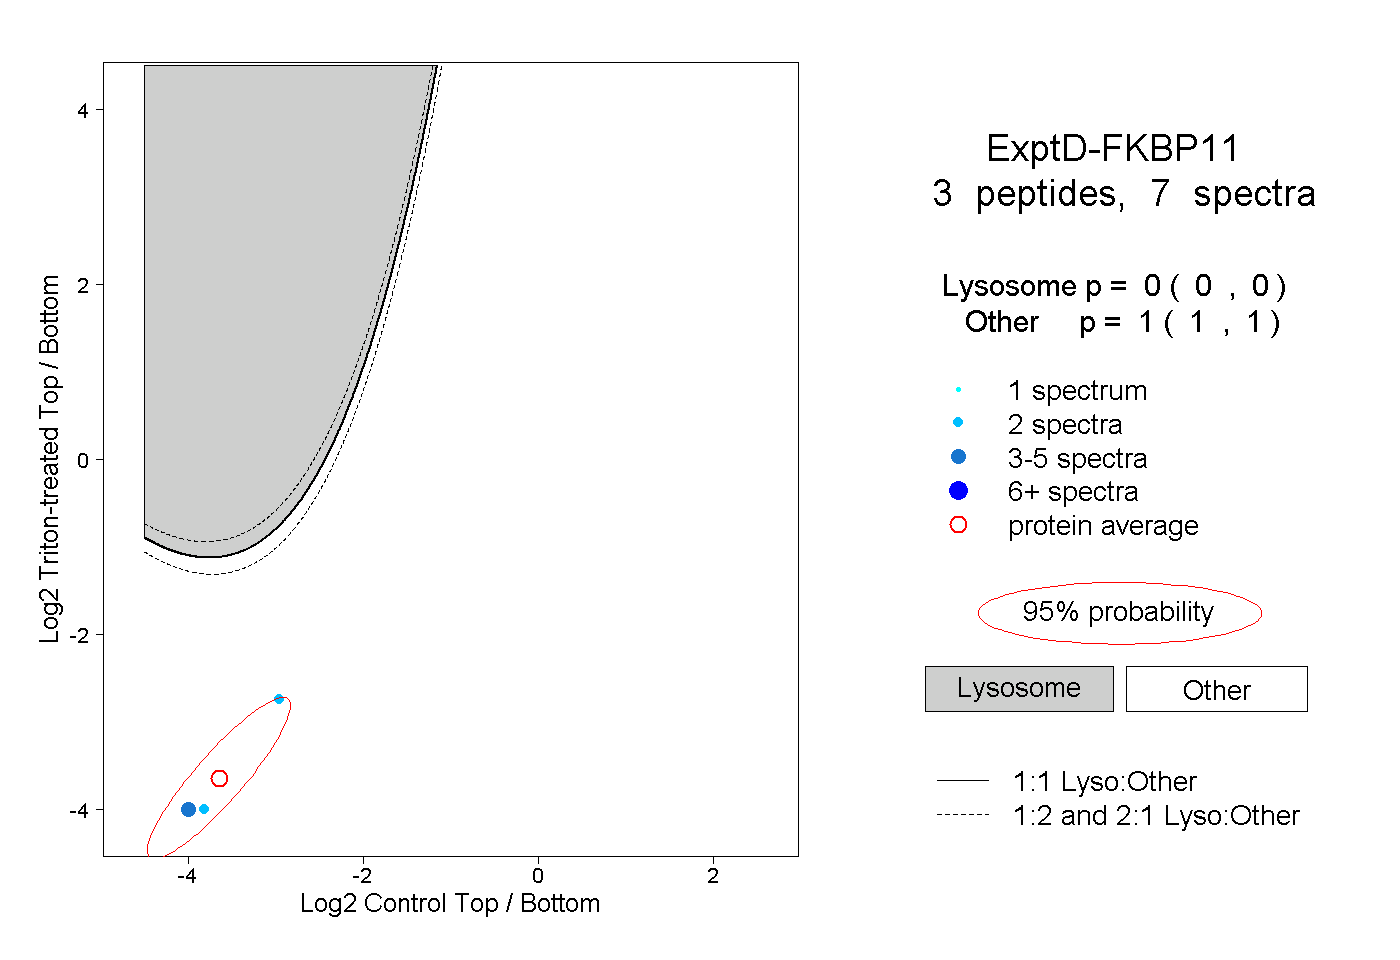
5peptides
spectra
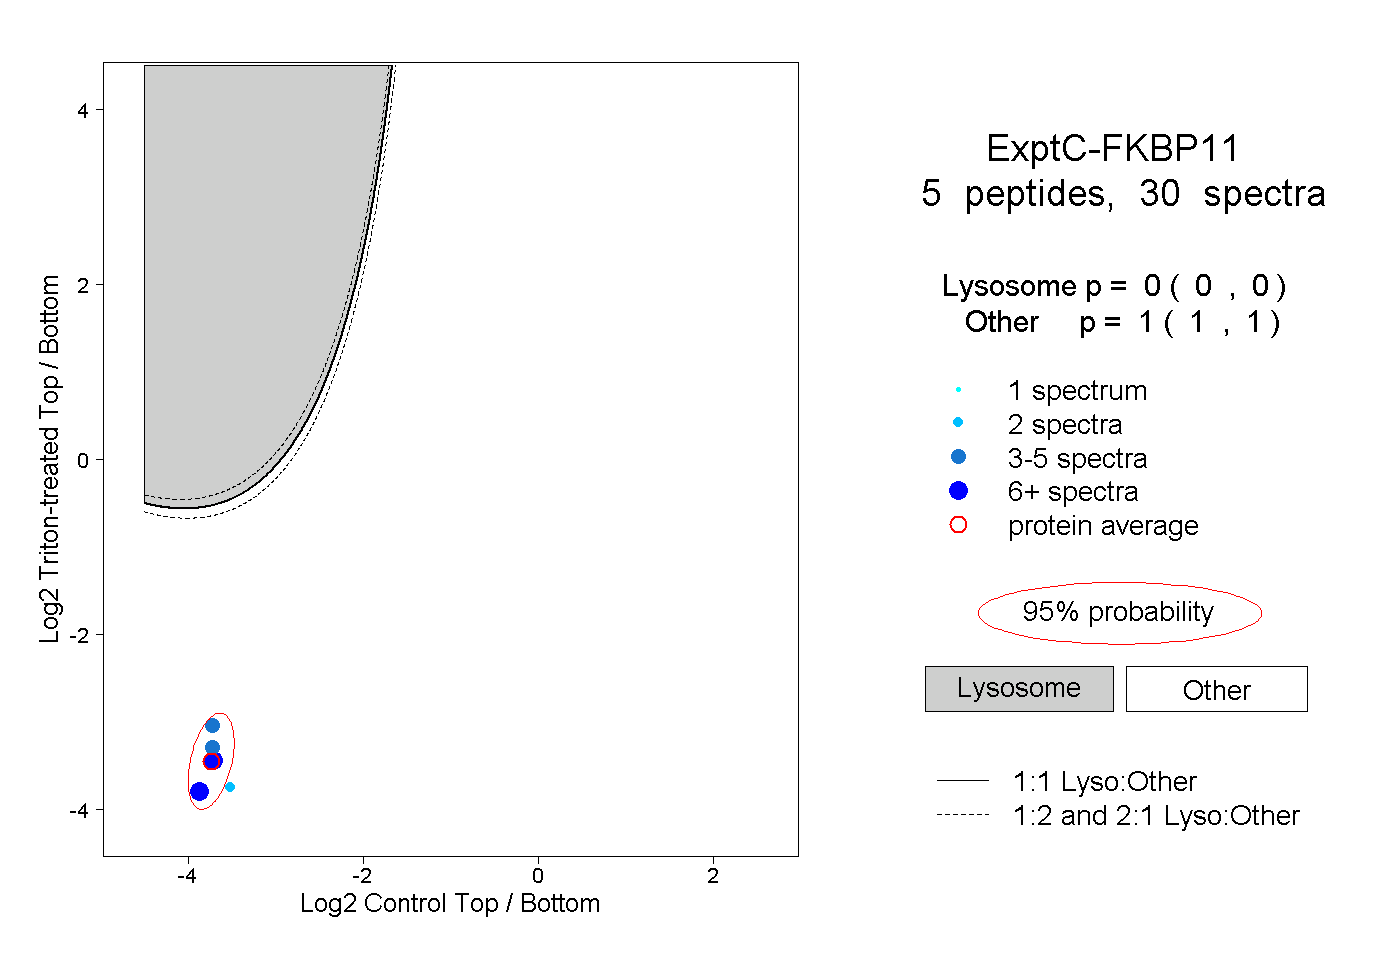
0.000 | 0.000
1.000 | 1.000