 3
3peptides
spectra
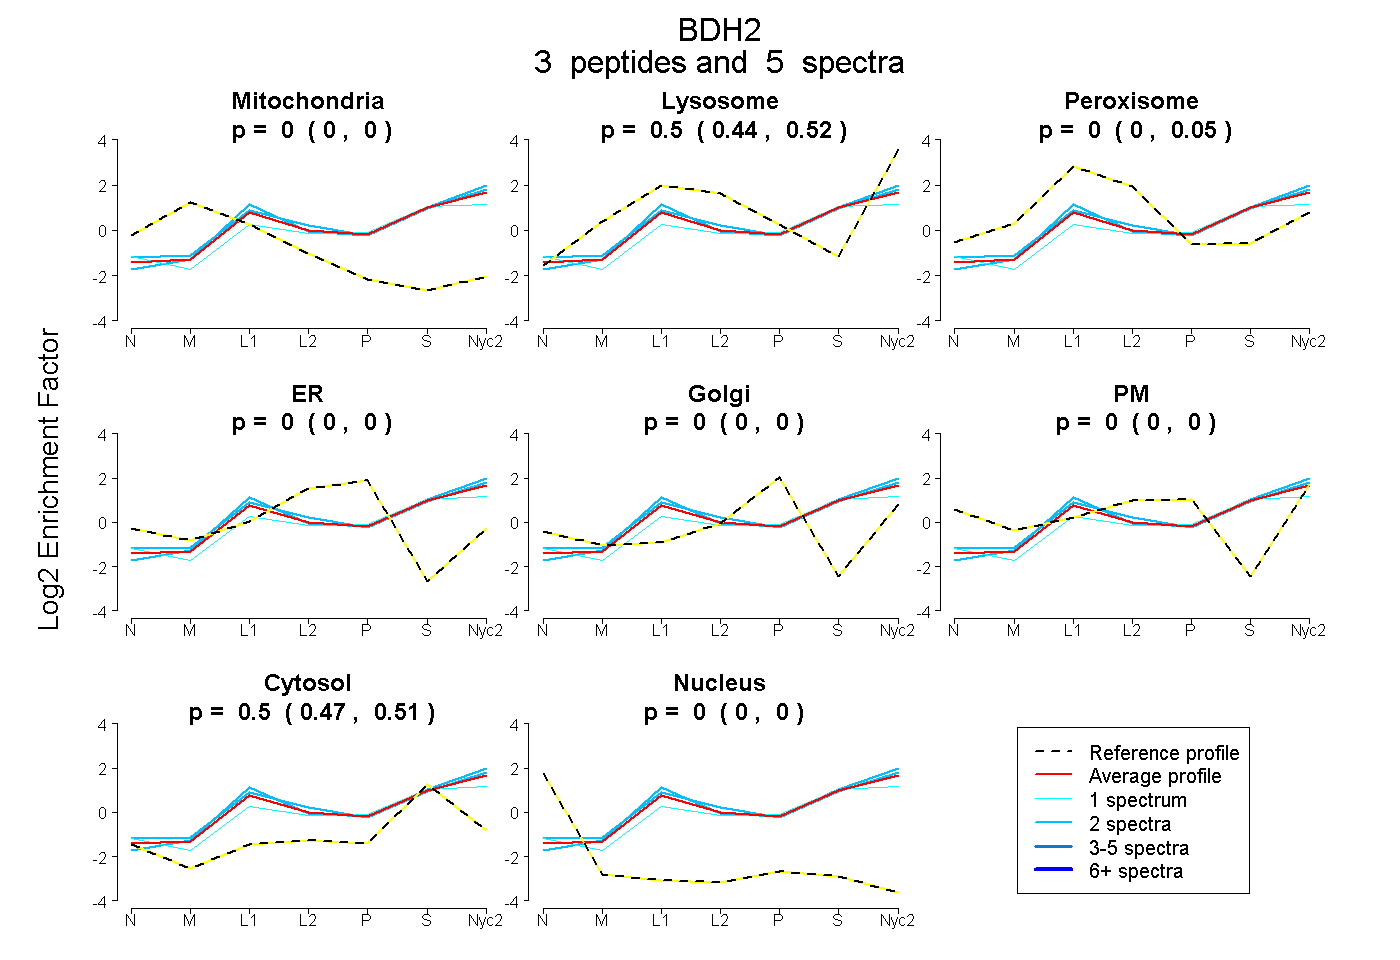
0.000 | 0.000
0.442 | 0.521
0.000 | 0.052
0.000 | 0.000
0.000 | 0.000
0.000 | 0.000
0.471 | 0.515
0.000 | 0.000
3peptides
spectra
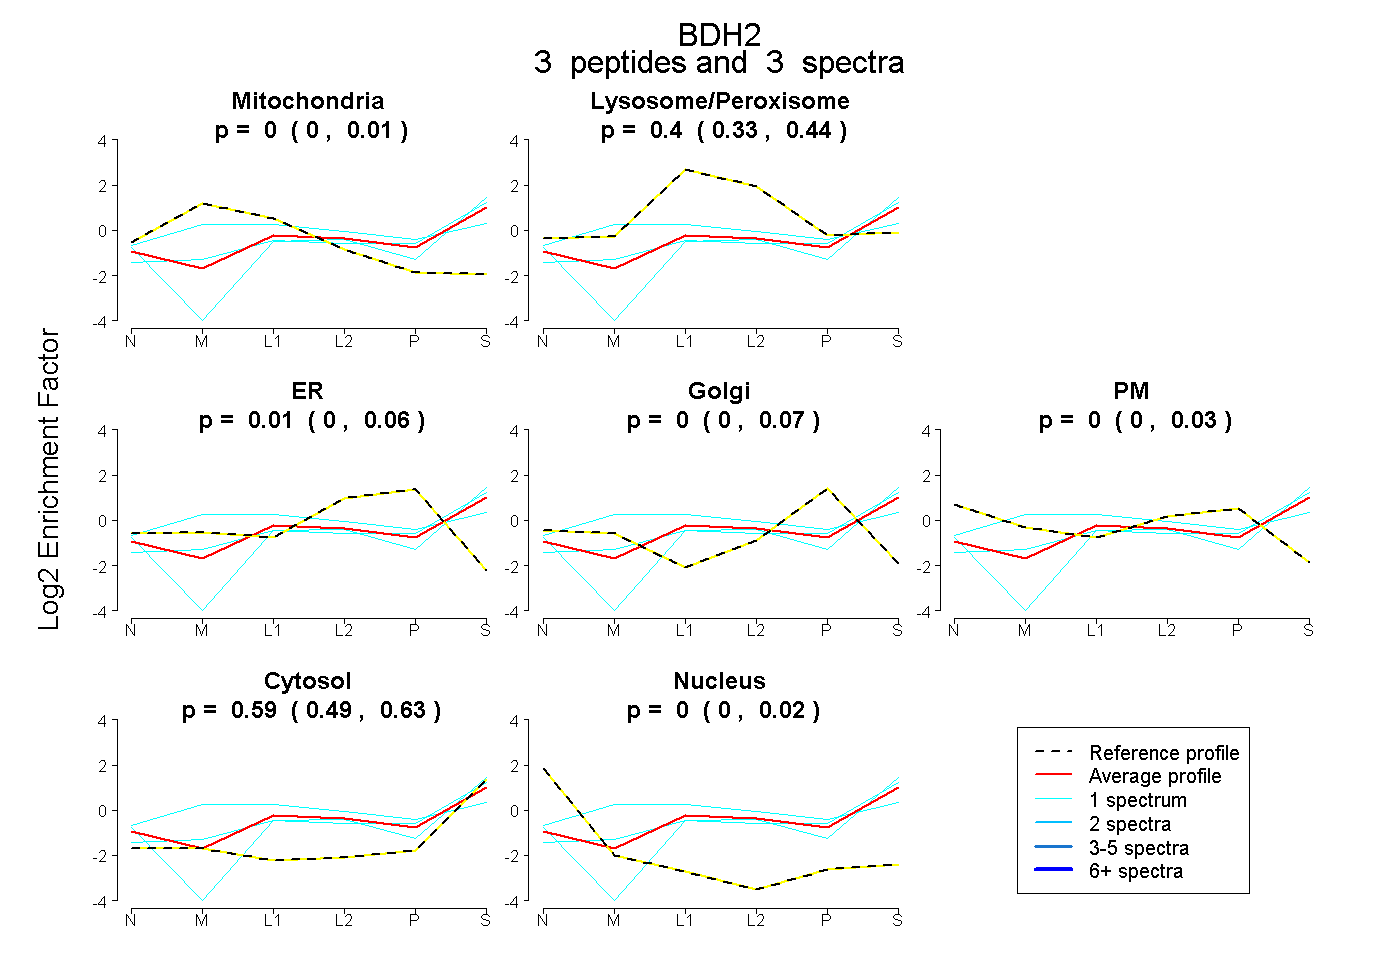
0.000 | 0.014
0.333 | 0.436
0.000 | 0.058
0.000 | 0.067
0.000 | 0.030
0.490 | 0.632
0.000 | 0.023
8peptides
spectra
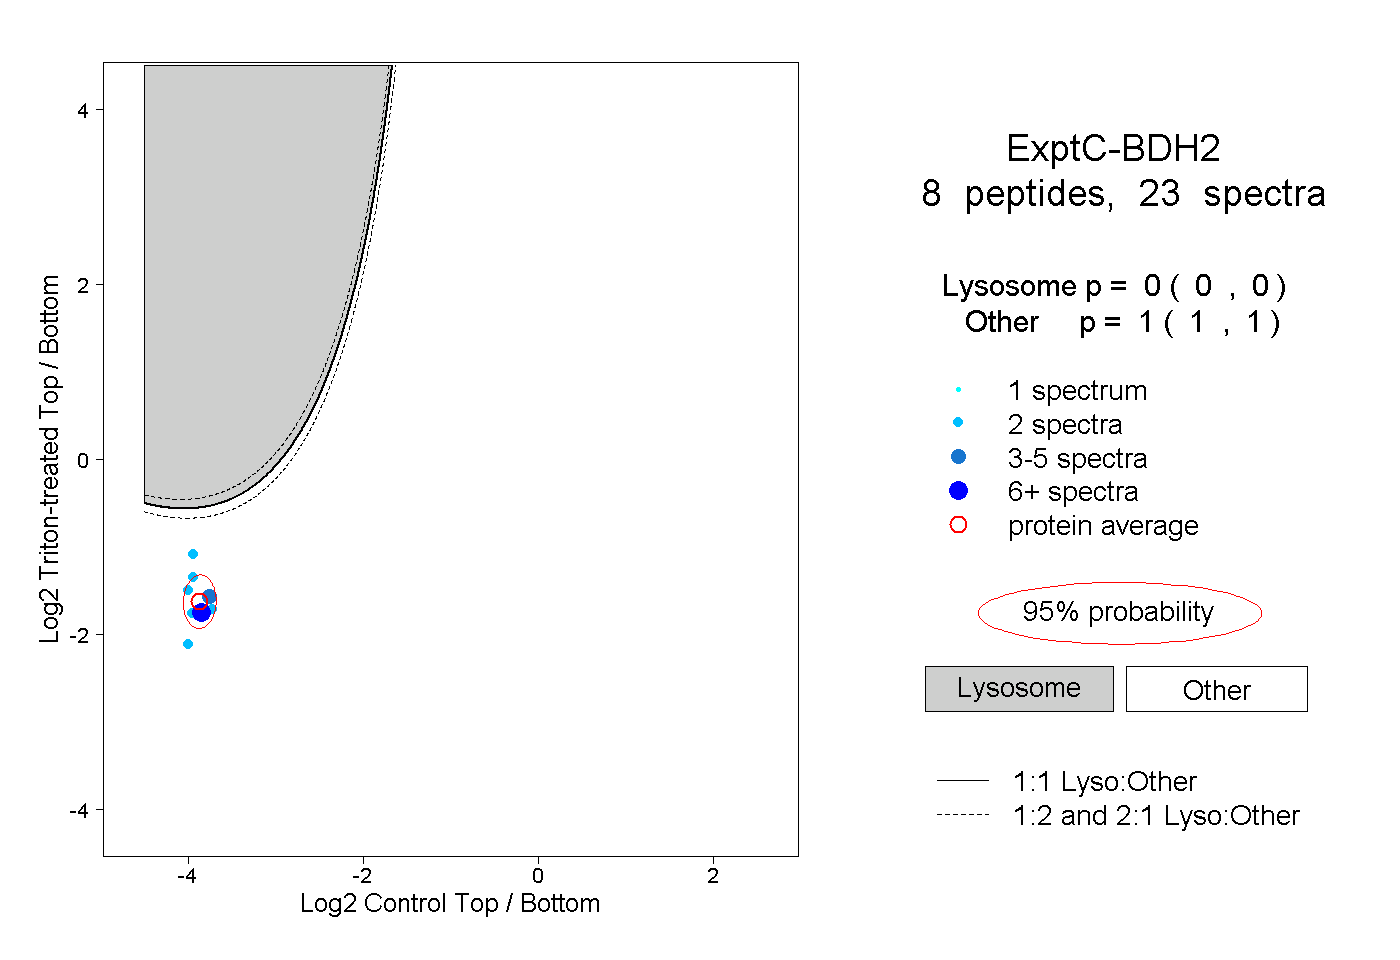
0.000 | 0.000
1.000 | 1.000