 2
2peptides
spectra
0.000 | 0.004
0.626 | 0.901
0.000 | 0.124
0.000 | 0.000
0.014 | 0.194
0.000 | 0.028
0.000 | 0.096
0.000 | 0.000
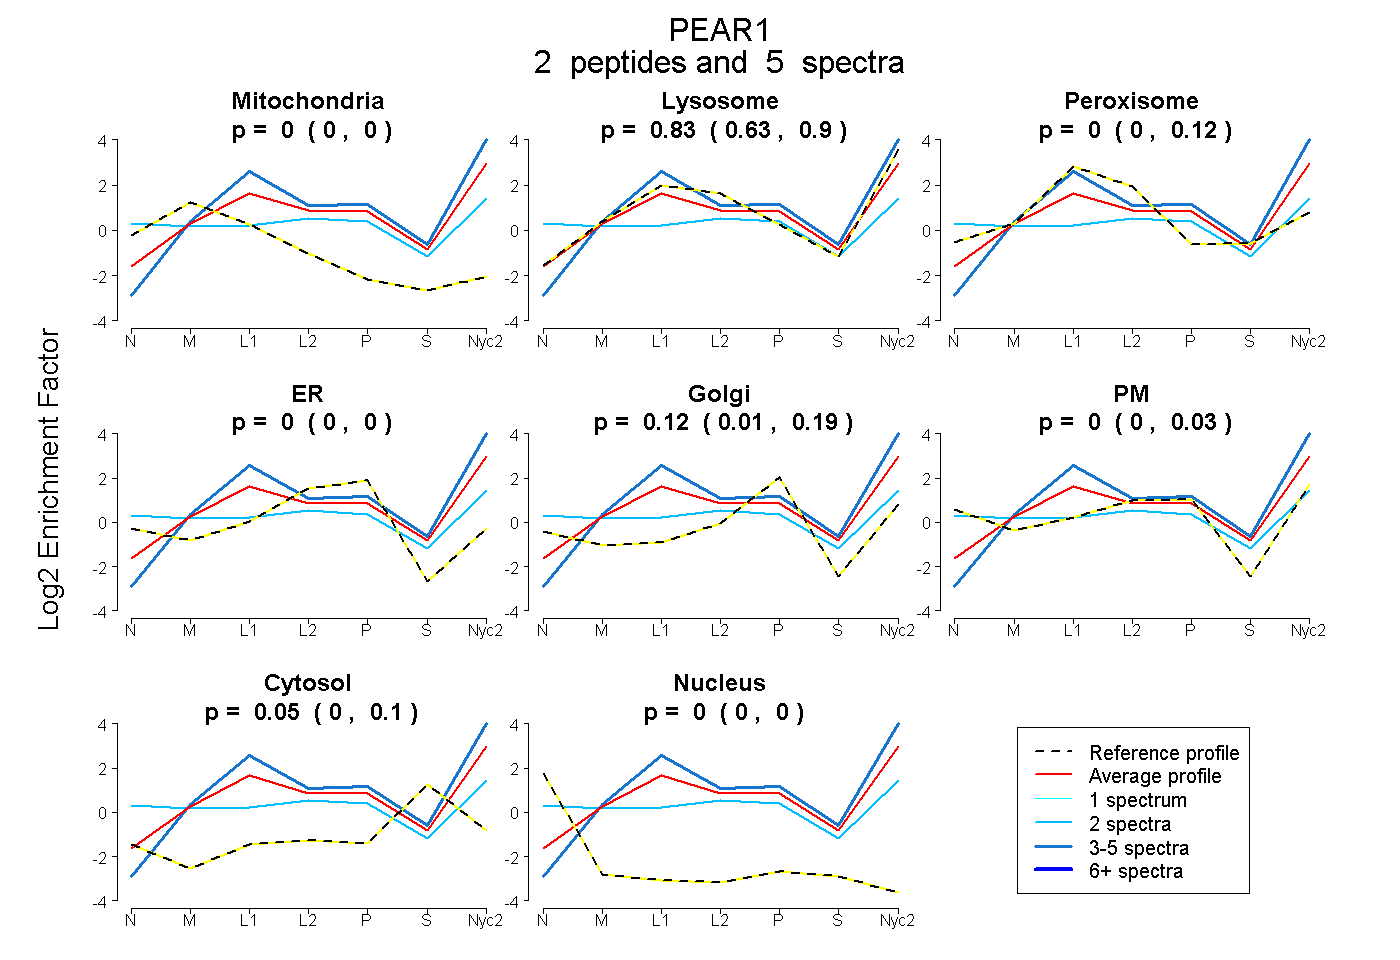
| Plot | Mito | Lyso | Perox | ER | Golgi | PM | Cytosol | Nucleus | |||||
| Expt A |
2 peptides |
5 spectra |
|
0.000 0.000 | 0.004 |
0.827 0.626 | 0.901 |
0.000 0.000 | 0.124 |
0.000 0.000 | 0.000 |
0.119 0.014 | 0.194 |
0.000 0.000 | 0.028 |
0.054 0.000 | 0.096 |
0.000 0.000 | 0.000 |