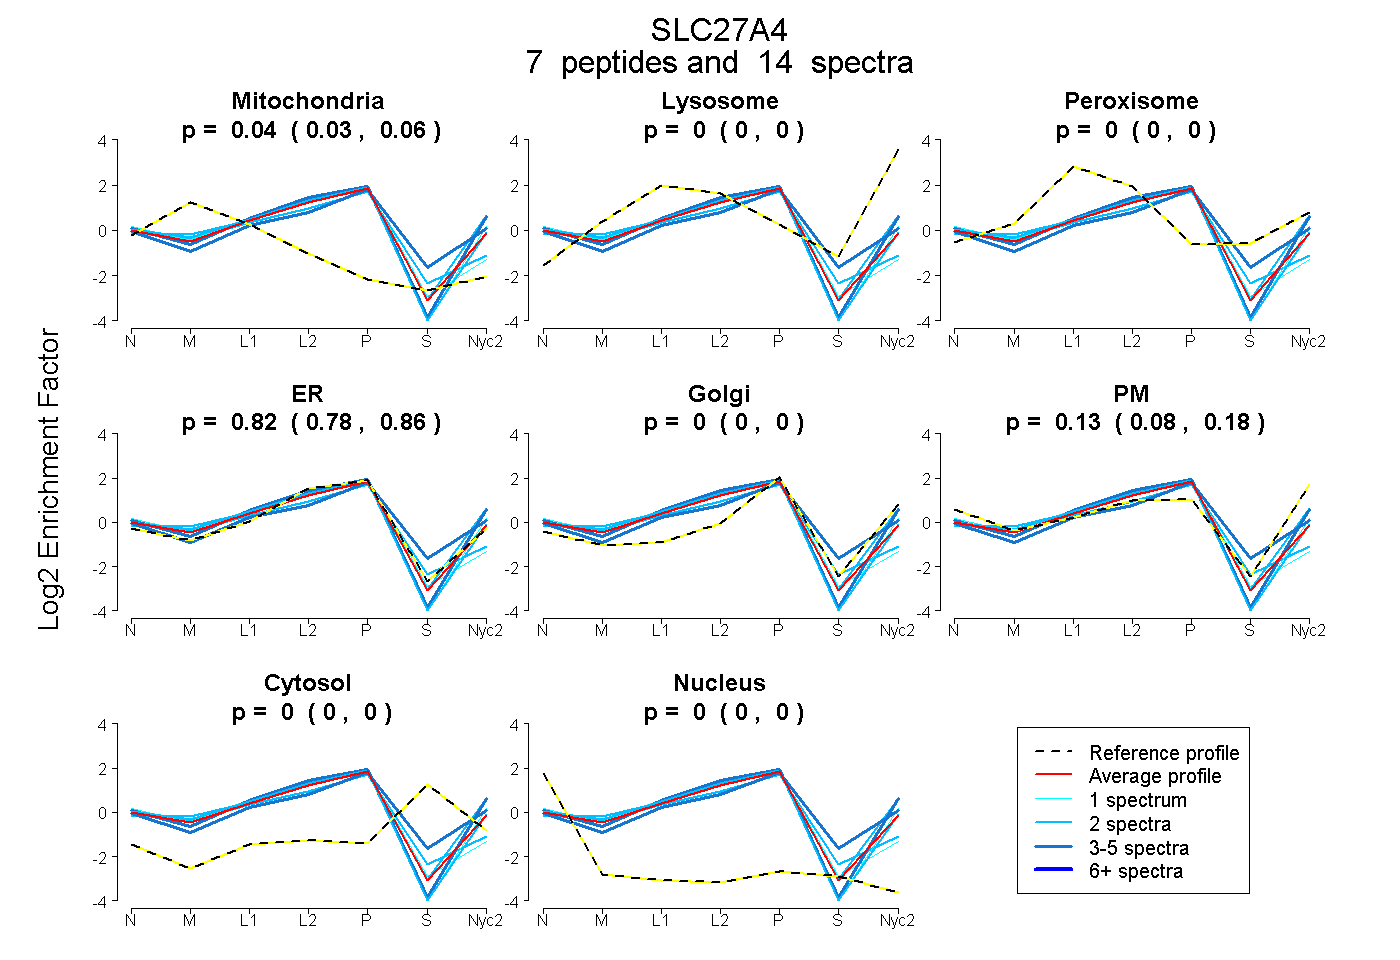
 7
7peptides
spectra
0.029 | 0.057
0.000 | 0.000
0.000 | 0.000
0.776 | 0.860
0.000 | 0.000
0.077 | 0.181
0.000 | 0.000
0.000 | 0.000
| Plot | Mito | Lyso | Perox | ER | Golgi | PM | Cytosol | Nucleus | |||||
| Expt A |
7 peptides |
14 spectra |
|
0.044 0.029 | 0.057 |
0.000 0.000 | 0.000 |
0.000 0.000 | 0.000 |
0.823 0.776 | 0.860 |
0.000 0.000 | 0.000 |
0.133 0.077 | 0.181 |
0.000 0.000 | 0.000 |
0.000 0.000 | 0.000 |
| 3 spectra, VNEDTMELIR | 0.000 | 0.000 | 0.135 | 0.468 | 0.335 | 0.000 | 0.062 | 0.000 | ||
| 1 spectrum, LGVEAALINTNLR | 0.010 | 0.000 | 0.000 | 0.754 | 0.000 | 0.236 | 0.000 | 0.000 | ||
| 1 spectrum, FWDDCIK | 0.110 | 0.000 | 0.000 | 0.890 | 0.000 | 0.000 | 0.000 | 0.000 | ||
| 2 spectra, QSIWTDFSSR | 0.000 | 0.065 | 0.000 | 0.629 | 0.000 | 0.307 | 0.000 | 0.000 | ||
| 3 spectra, TVPLLFASVVR | 0.000 | 0.000 | 0.000 | 0.664 | 0.000 | 0.336 | 0.000 | 0.000 | ||
| 2 spectra, YLLNQPPR | 0.040 | 0.000 | 0.000 | 0.839 | 0.000 | 0.121 | 0.000 | 0.000 | ||
| 2 spectra, FLPELHK | 0.140 | 0.000 | 0.000 | 0.848 | 0.000 | 0.000 | 0.000 | 0.012 |
| Plot | Lyso | Other | |||||||||||
| Expt C |
6 peptides |
17 spectra |
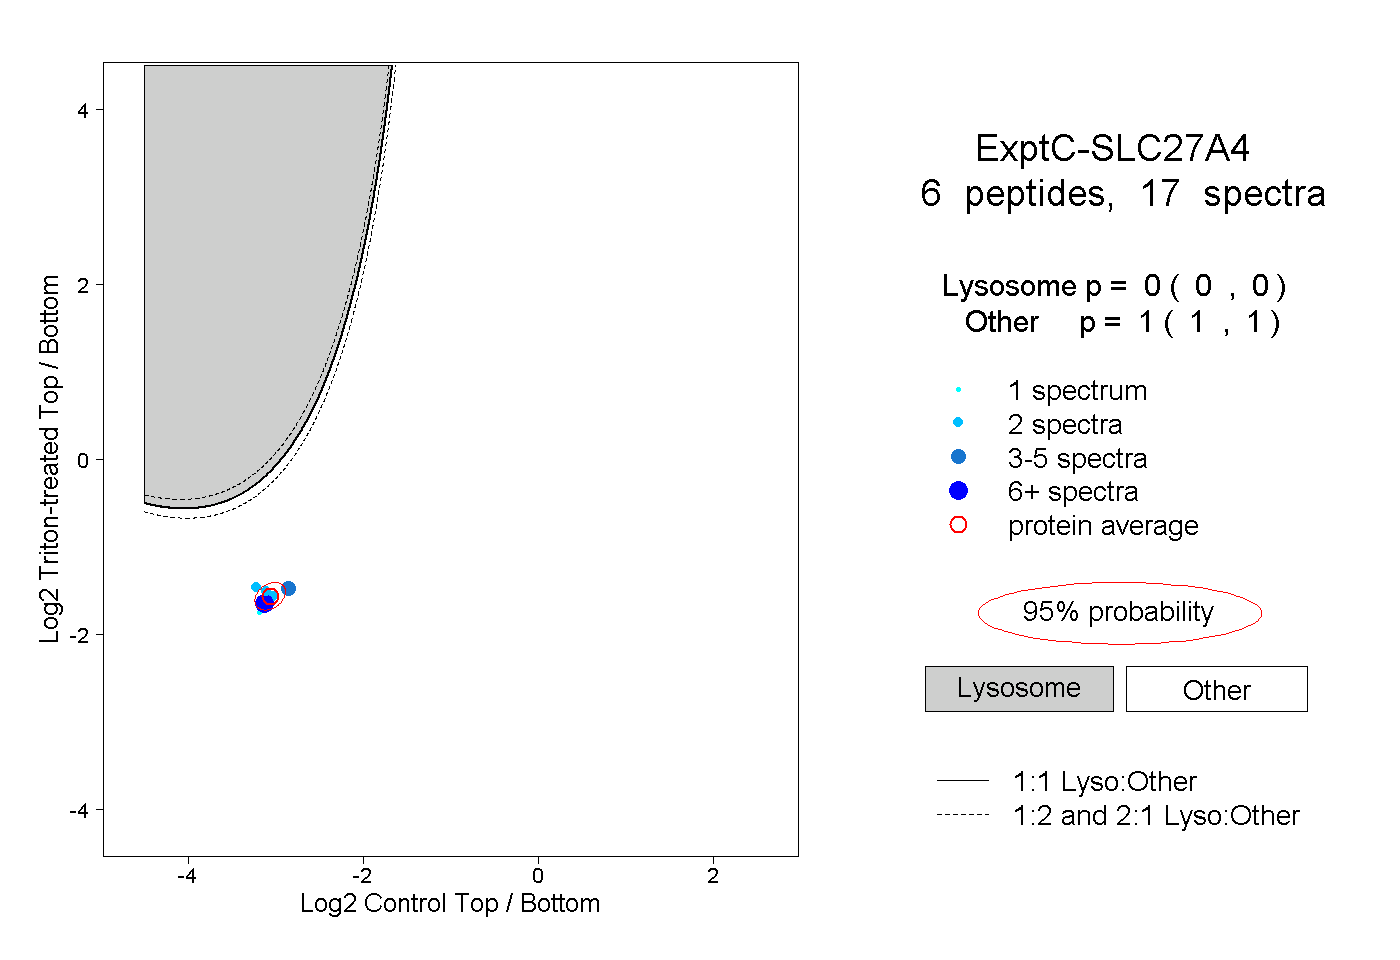 |
0.000 0.000 | 0.000 |
1.000 1.000 | 1.000 |