 7
7peptides
spectra
0.000 | 0.000
0.000 | 0.000
0.000 | 0.000
0.000 | 0.000
0.000 | 0.000
0.000 | 0.000
0.931 | 0.958
0.040 | 0.066
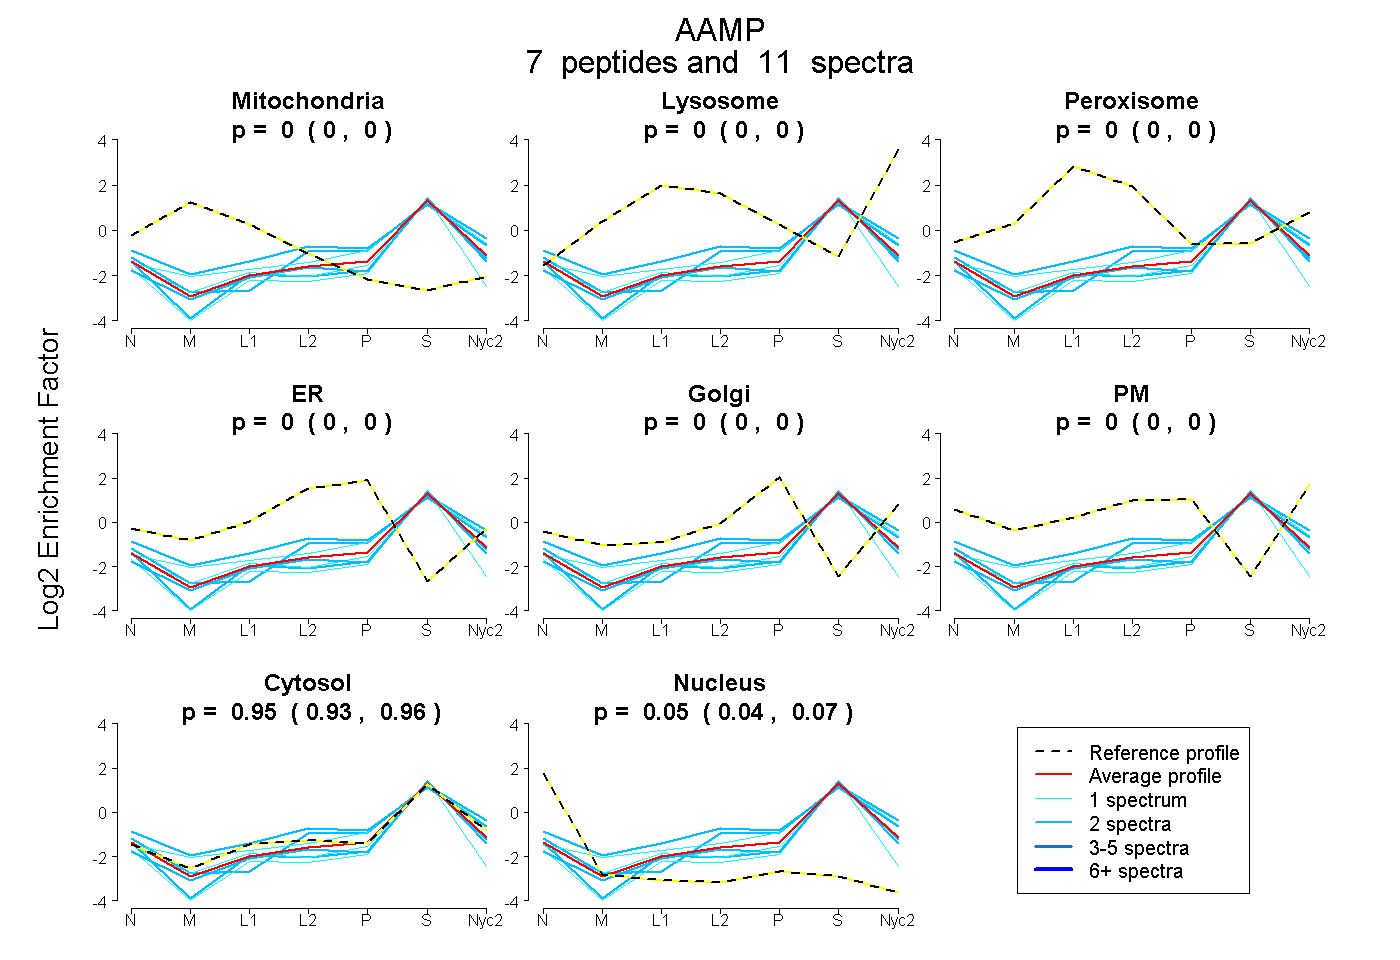
| Plot | Mito | Lyso | Perox | ER | Golgi | PM | Cytosol | Nucleus | |||||
| Expt A |
7 peptides |
11 spectra |
|
0.000 0.000 | 0.000 |
0.000 0.000 | 0.000 |
0.000 0.000 | 0.000 |
0.000 0.000 | 0.000 |
0.000 0.000 | 0.000 |
0.000 0.000 | 0.000 |
0.946 0.931 | 0.958 |
0.054 0.040 | 0.066 |
| 2 spectra, TFQGPNCPATCGR | 0.000 | 0.000 | 0.000 | 0.000 | 0.000 | 0.000 | 0.945 | 0.055 | ||
| 1 spectrum, QGNPIHVLK | 0.000 | 0.000 | 0.000 | 0.000 | 0.076 | 0.000 | 0.924 | 0.000 | ||
| 1 spectrum, LSDGELLFECAGHK | 0.000 | 0.000 | 0.000 | 0.000 | 0.000 | 0.000 | 0.832 | 0.168 | ||
| 2 spectra, GHTAEILDFALSK | 0.000 | 0.000 | 0.000 | 0.000 | 0.066 | 0.000 | 0.934 | 0.000 | ||
| 1 spectrum, LLTDYR | 0.000 | 0.000 | 0.000 | 0.000 | 0.000 | 0.000 | 0.937 | 0.063 | ||
| 2 spectra, AVVGYEDGTIR | 0.000 | 0.000 | 0.000 | 0.000 | 0.000 | 0.000 | 0.908 | 0.092 | ||
| 2 spectra, VWQVETK | 0.000 | 0.000 | 0.010 | 0.052 | 0.000 | 0.086 | 0.852 | 0.000 |
| Plot | Mito | Lyso or Perox | ER | Golgi | PM | Cytosol | Nucleus | ||||||
| Expt B |
2 peptides |
4 spectra |
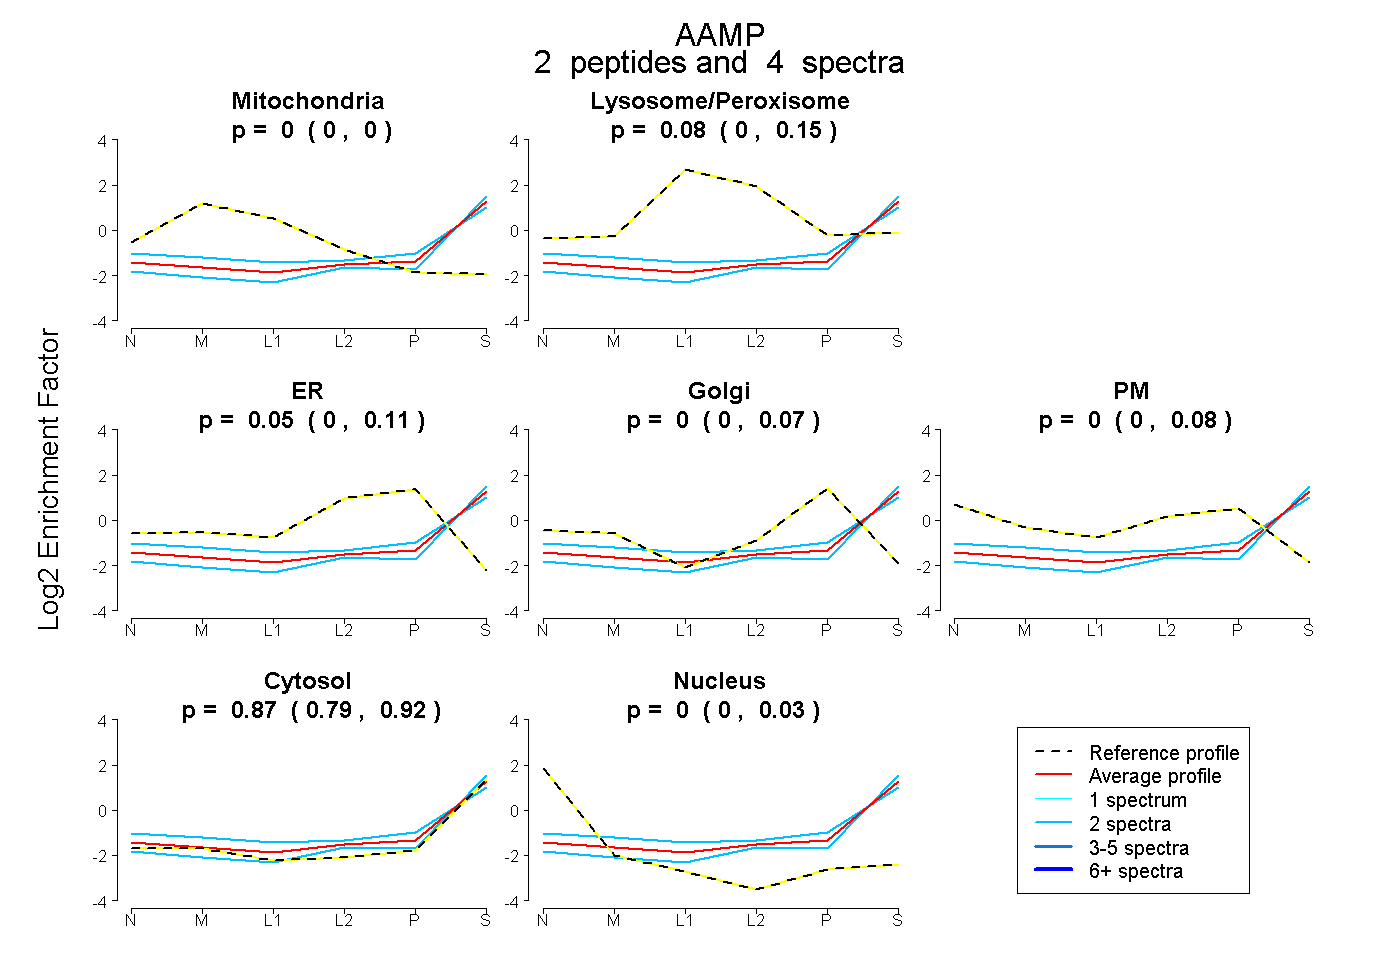 |
0.000 0.000 | 0.002 |
0.076 0.000 | 0.153 |
0.050 0.000 | 0.110 |
0.000 0.000 | 0.070 |
0.000 0.000 | 0.079 |
0.874 0.793 | 0.923 |
0.000 0.000 | 0.026 |
|||
| Plot | Lyso | Other | |||||||||||
| Expt C |
3 peptides |
7 spectra |
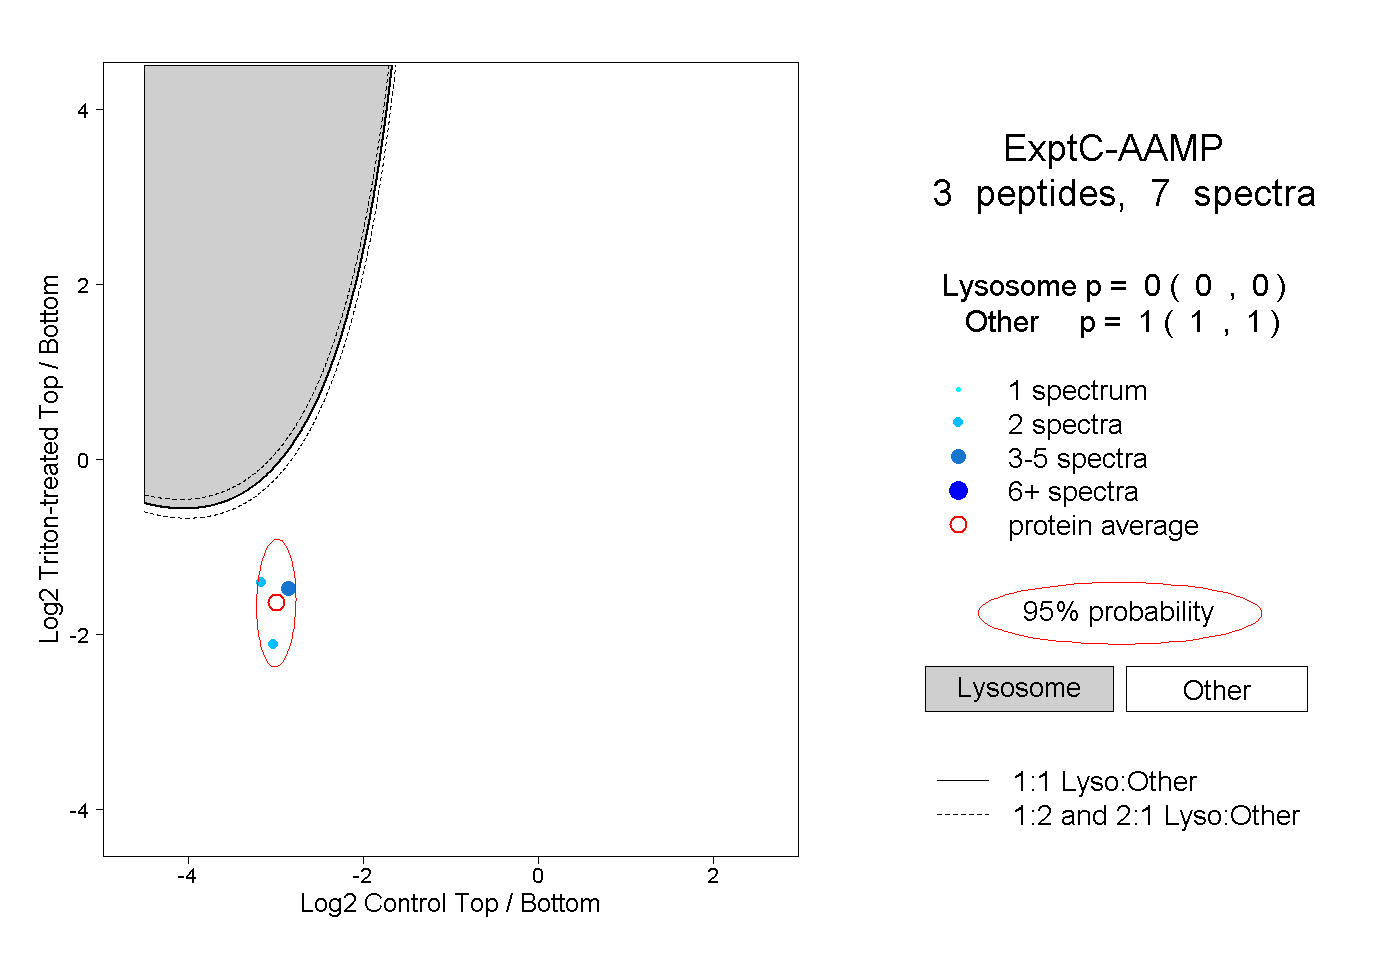 |
0.000 0.000 | 0.000 |
1.000 1.000 | 1.000 |