 7
7peptides
spectra
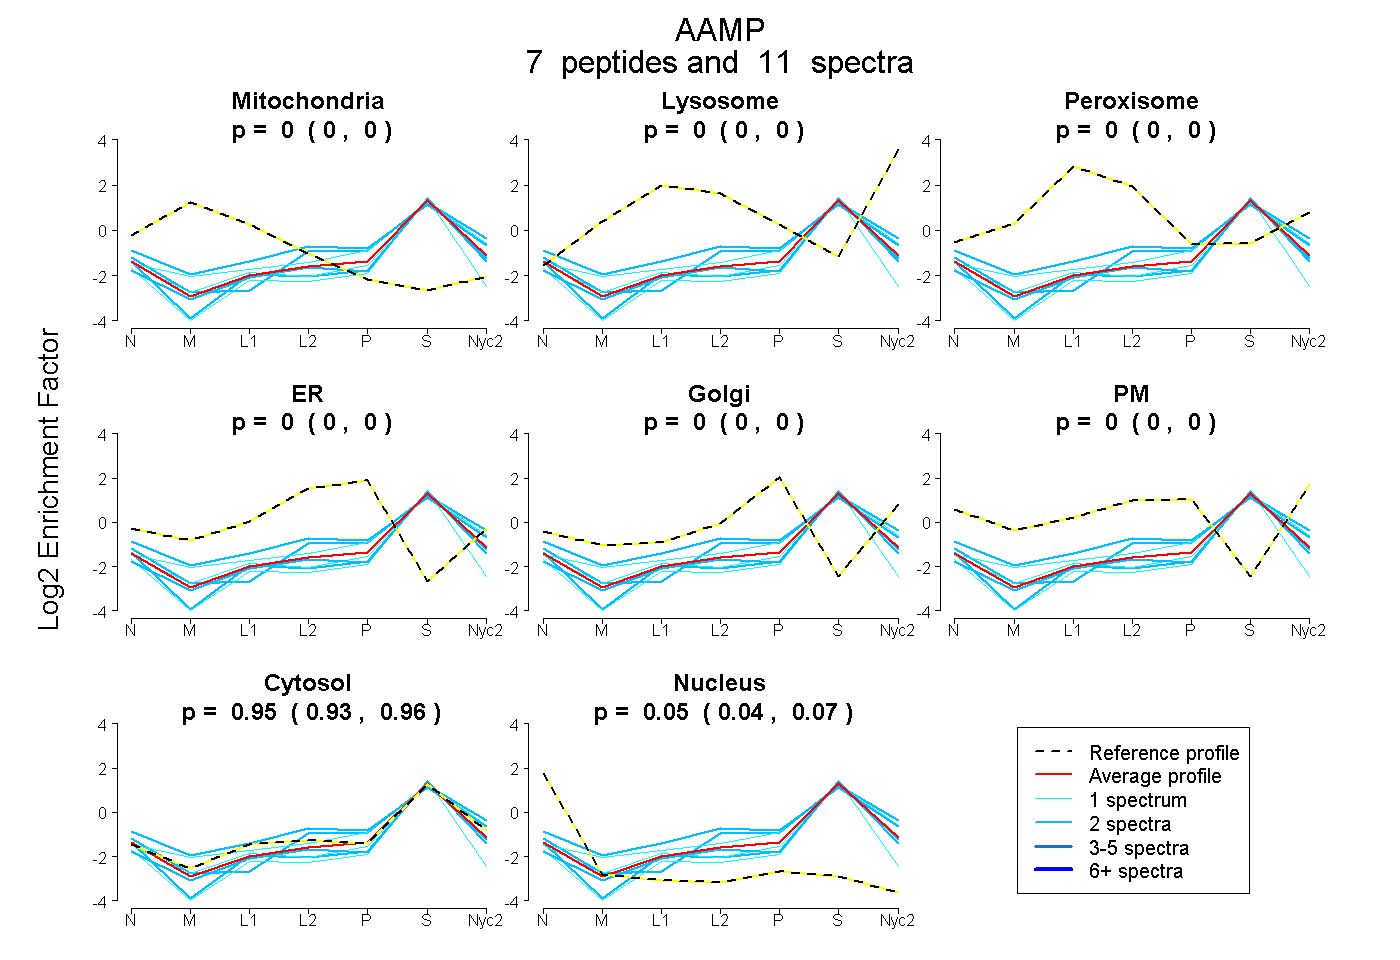
0.000 | 0.000
0.000 | 0.000
0.000 | 0.000
0.000 | 0.000
0.000 | 0.000
0.000 | 0.000
0.931 | 0.958
0.040 | 0.066
2peptides
spectra
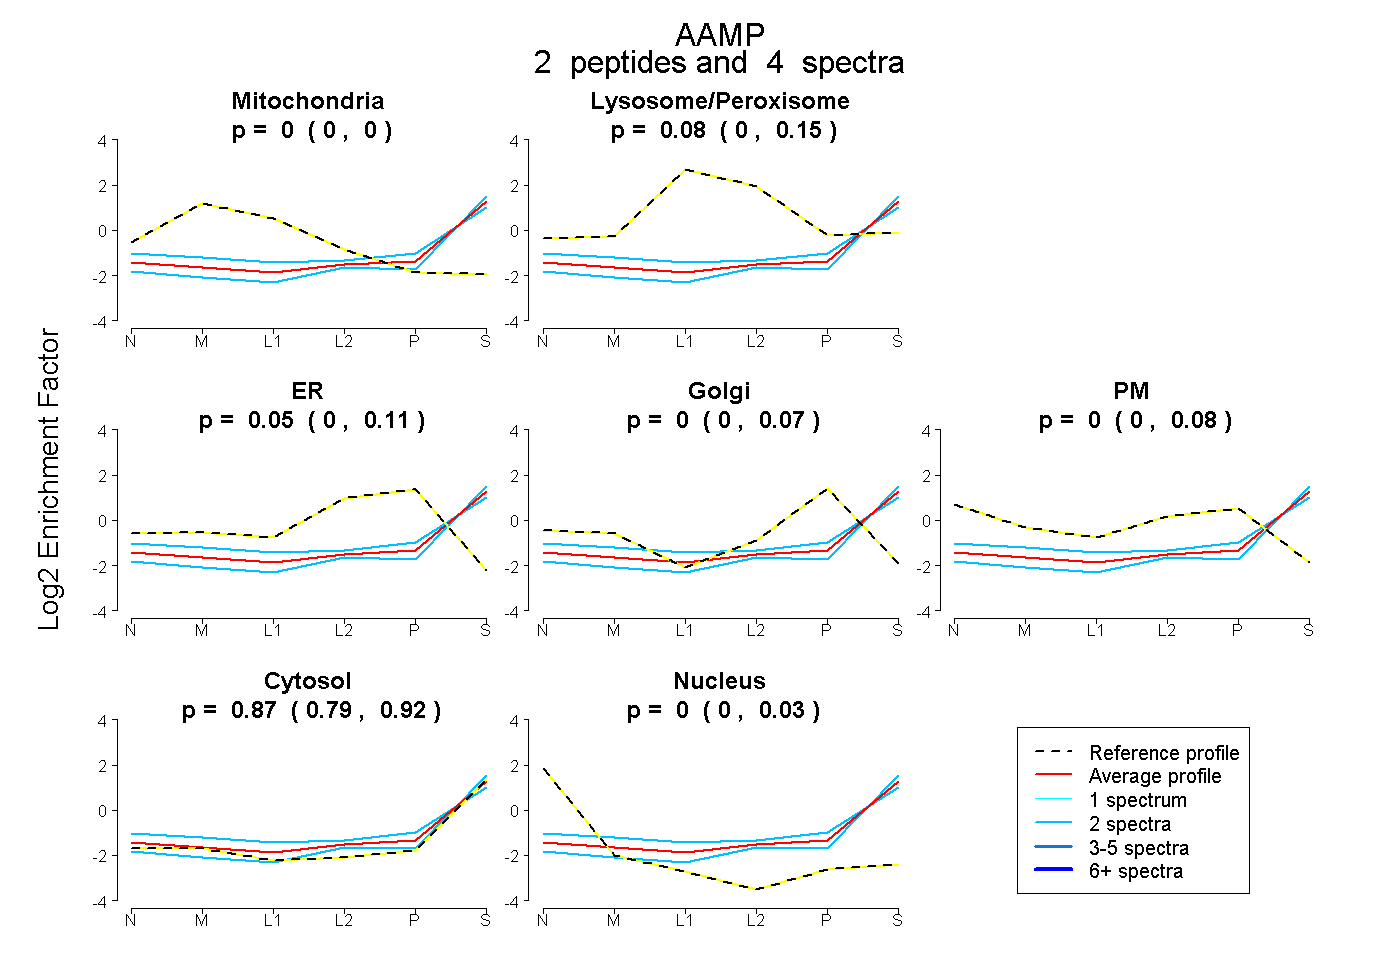
0.000 | 0.002
0.000 | 0.153
0.000 | 0.110
0.000 | 0.070
0.000 | 0.079
0.793 | 0.923
0.000 | 0.026
3peptides
spectra
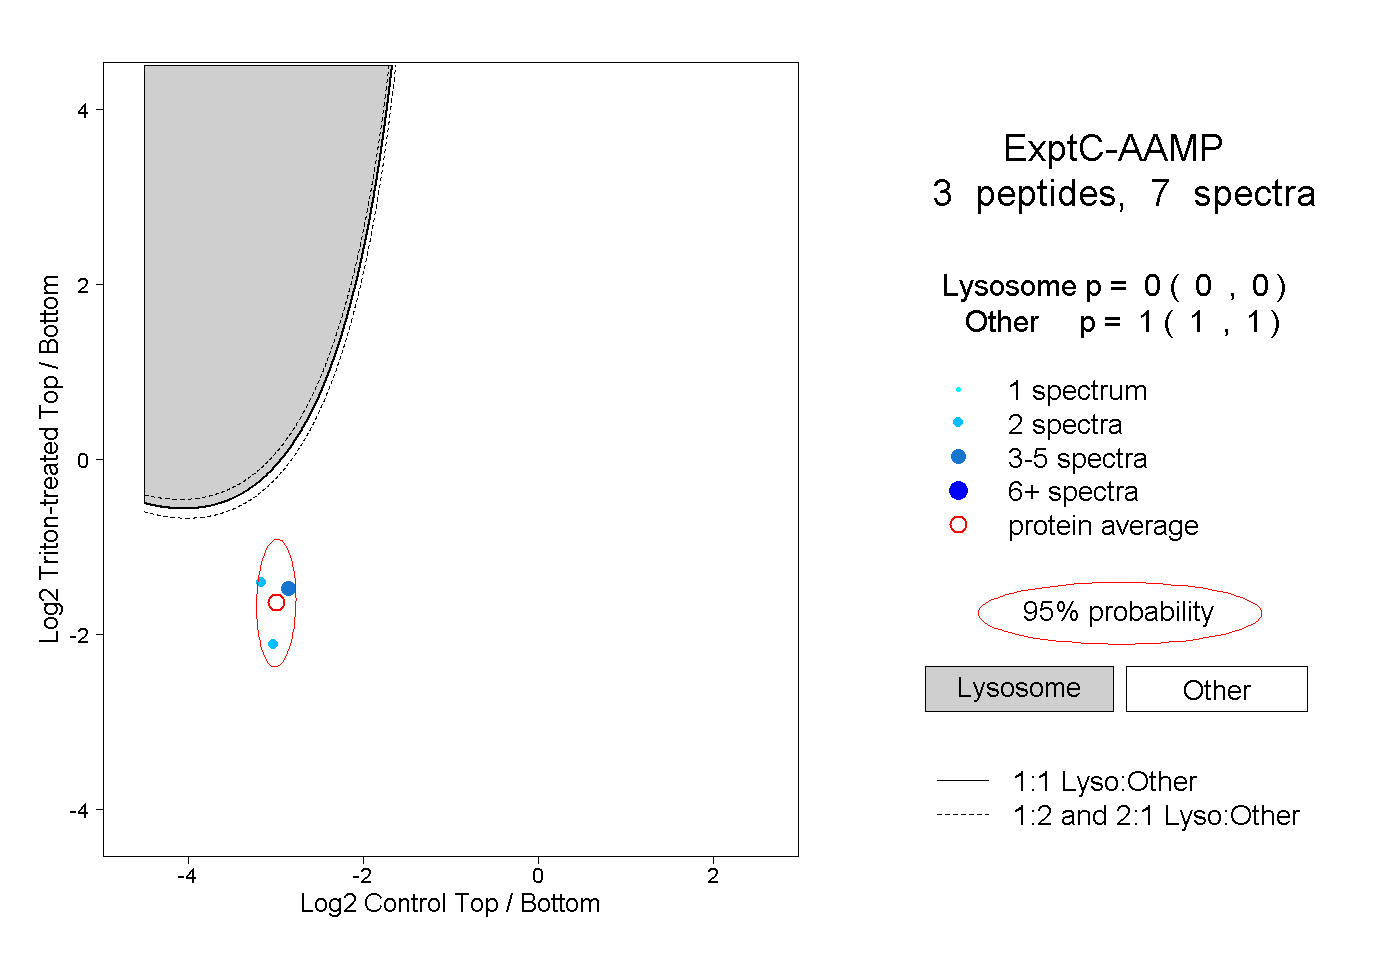
0.000 | 0.000
1.000 | 1.000