BZW1
[ENSRNOP00000019486]
Main page
| | | Plot |
Mito |
Lyso |
|
Perox |
ER |
Golgi |
PM |
Cytosol |
Nucleus |
|
| Expt A |
 20
20
peptides |
68
spectra |
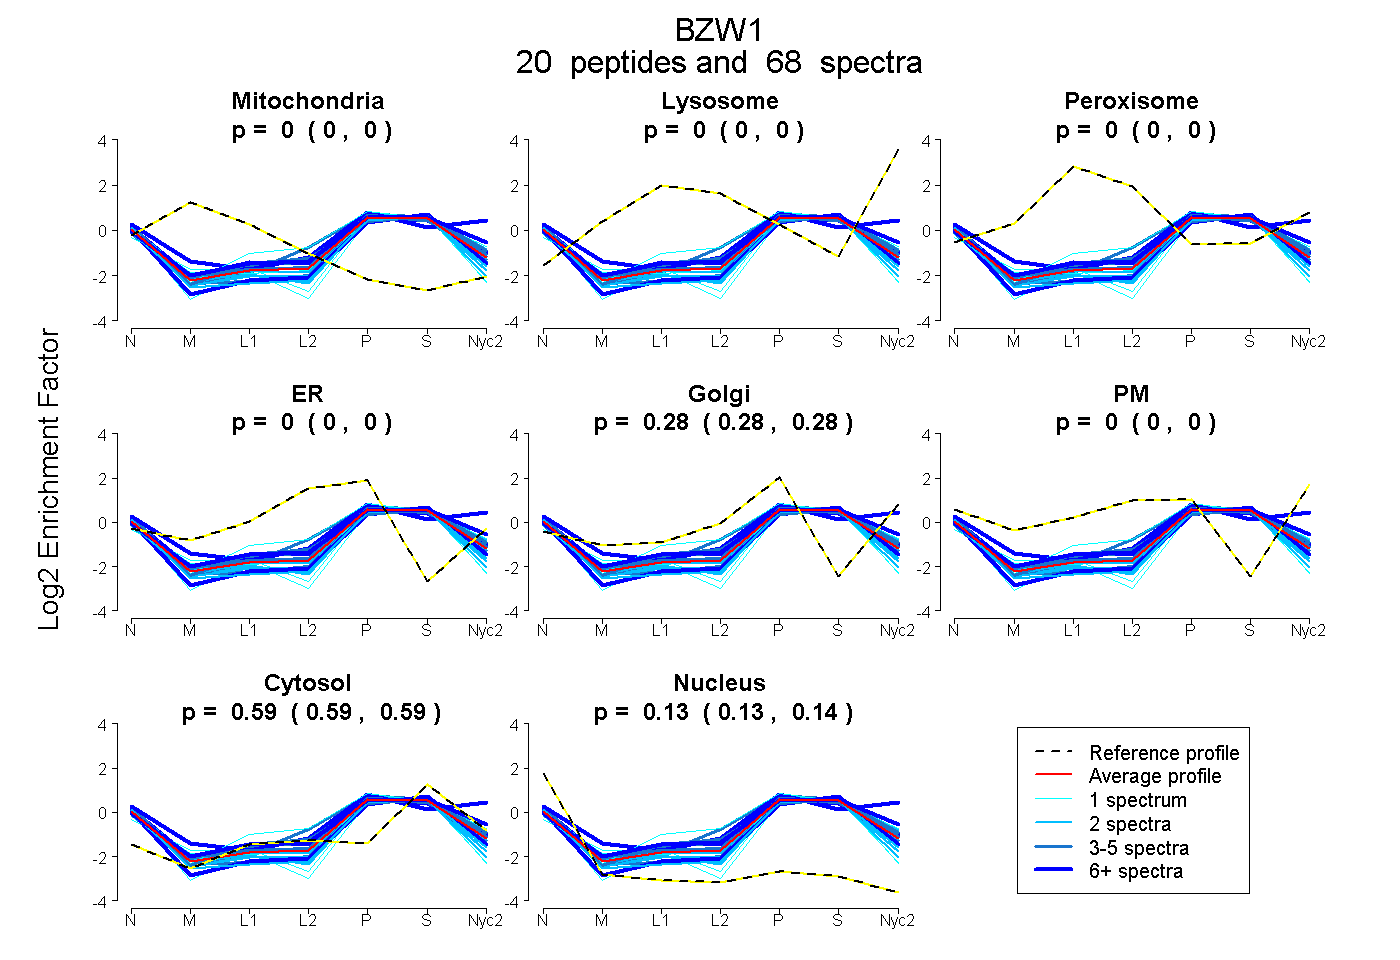 |
0.000
0.000 | 0.000 |
0.000
0.000 | 0.000 |
|
0.000
0.000 | 0.000 |
0.000
0.000 | 0.000 |
0.279
0.276 | 0.281 |
0.000
0.000 | 0.000 |
0.589
0.587 | 0.590 |
0.133
0.129 | 0.135 |
|
| | | Plot |
Mito |
|
Lyso or Perox |
|
ER |
Golgi |
PM |
Cytosol |
Nucleus |
|
| Expt B |
11
peptides |
23
spectra |
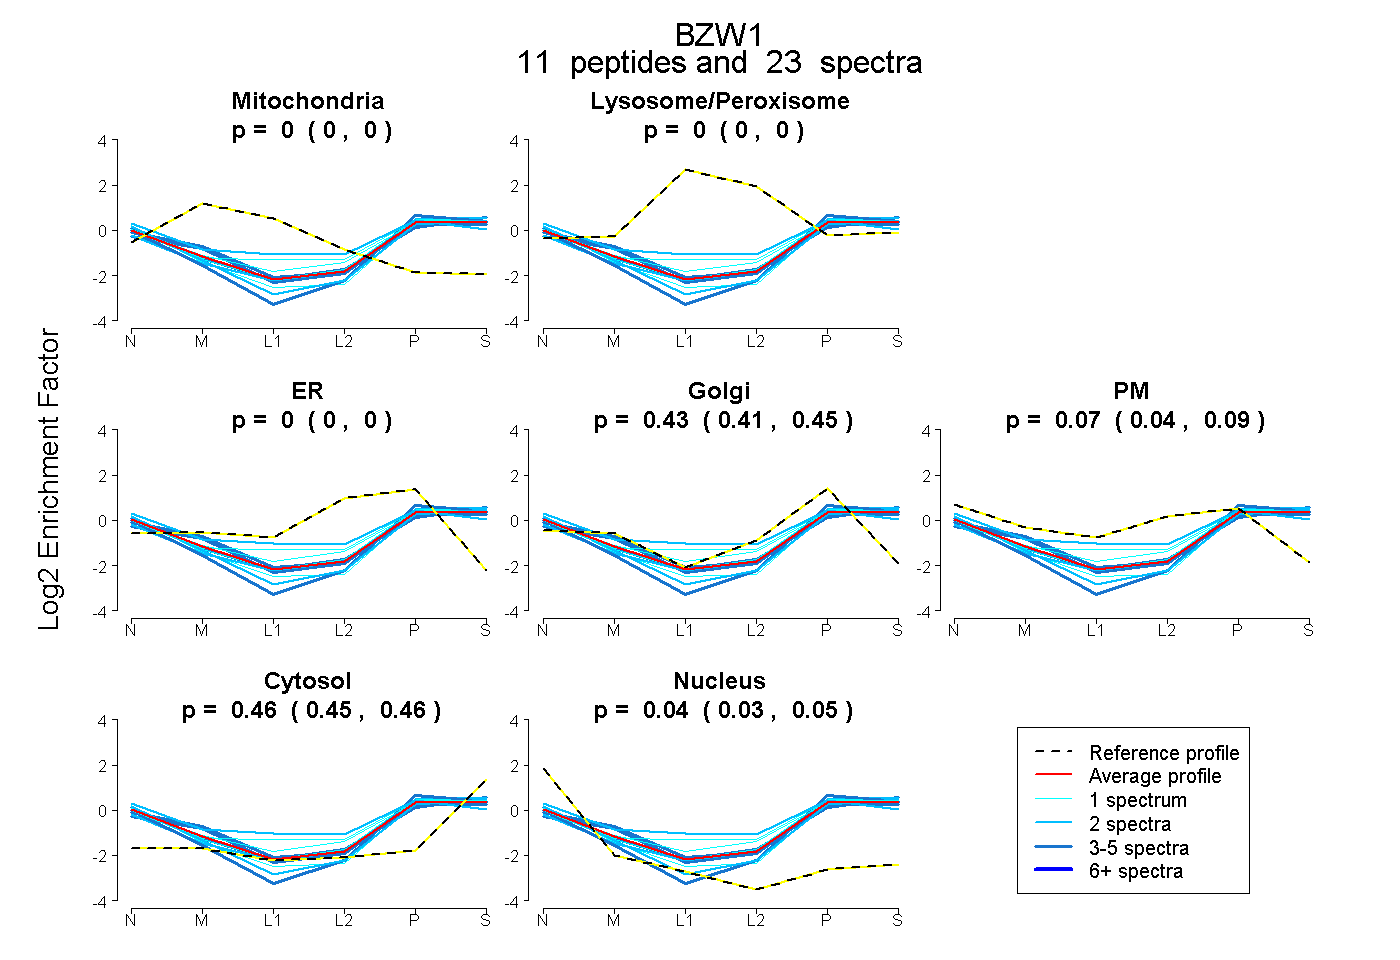 |
0.000
0.000 | 0.000 |
|
0.000
0.000 | 0.000 |
|
0.000
0.000 | 0.000 |
0.433
0.411 | 0.454 |
0.067
0.040 | 0.089 |
0.457
0.452 | 0.462 |
0.042
0.035 | 0.049 |
|
| 1 spectrum, LLLFLK |
0.000 |
|
0.074 |
|
0.000 |
0.235 |
0.263 |
0.428 |
0.000 |
|
| 1 spectrum, EGVSAAFAVK |
0.000 |
|
0.000 |
|
0.000 |
0.418 |
0.000 |
0.445 |
0.137 |
|
| 4 spectra, DINAVAASLR |
0.000 |
|
0.000 |
|
0.000 |
0.505 |
0.000 |
0.474 |
0.021 |
|
| 2 spectra, NQQTIGAR |
0.000 |
|
0.055 |
|
0.000 |
0.120 |
0.479 |
0.346 |
0.000 |
|
| 3 spectra, AEVLSEEPILK |
0.000 |
|
0.000 |
|
0.000 |
0.296 |
0.148 |
0.508 |
0.047 |
|
| 3 spectra, FLDASGAK |
0.000 |
|
0.000 |
|
0.000 |
0.411 |
0.106 |
0.445 |
0.037 |
|
| 2 spectra, ELQEQMSR |
0.000 |
|
0.000 |
|
0.000 |
0.485 |
0.000 |
0.507 |
0.008 |
|
| 2 spectra, IVVLFYK |
0.000 |
|
0.000 |
|
0.000 |
0.415 |
0.000 |
0.458 |
0.127 |
|
| 3 spectra, ELSEYVR |
0.000 |
|
0.000 |
|
0.000 |
0.467 |
0.000 |
0.440 |
0.093 |
|
| 1 spectrum, FVEWLK |
0.000 |
|
0.000 |
|
0.000 |
0.246 |
0.283 |
0.471 |
0.000 |
|
| 1 spectrum, GFEDEVK |
0.000 |
|
0.000 |
|
0.000 |
0.450 |
0.064 |
0.463 |
0.023 |
|
| | | Plot |
|
Lyso |
|
|
|
|
|
|
|
Other |
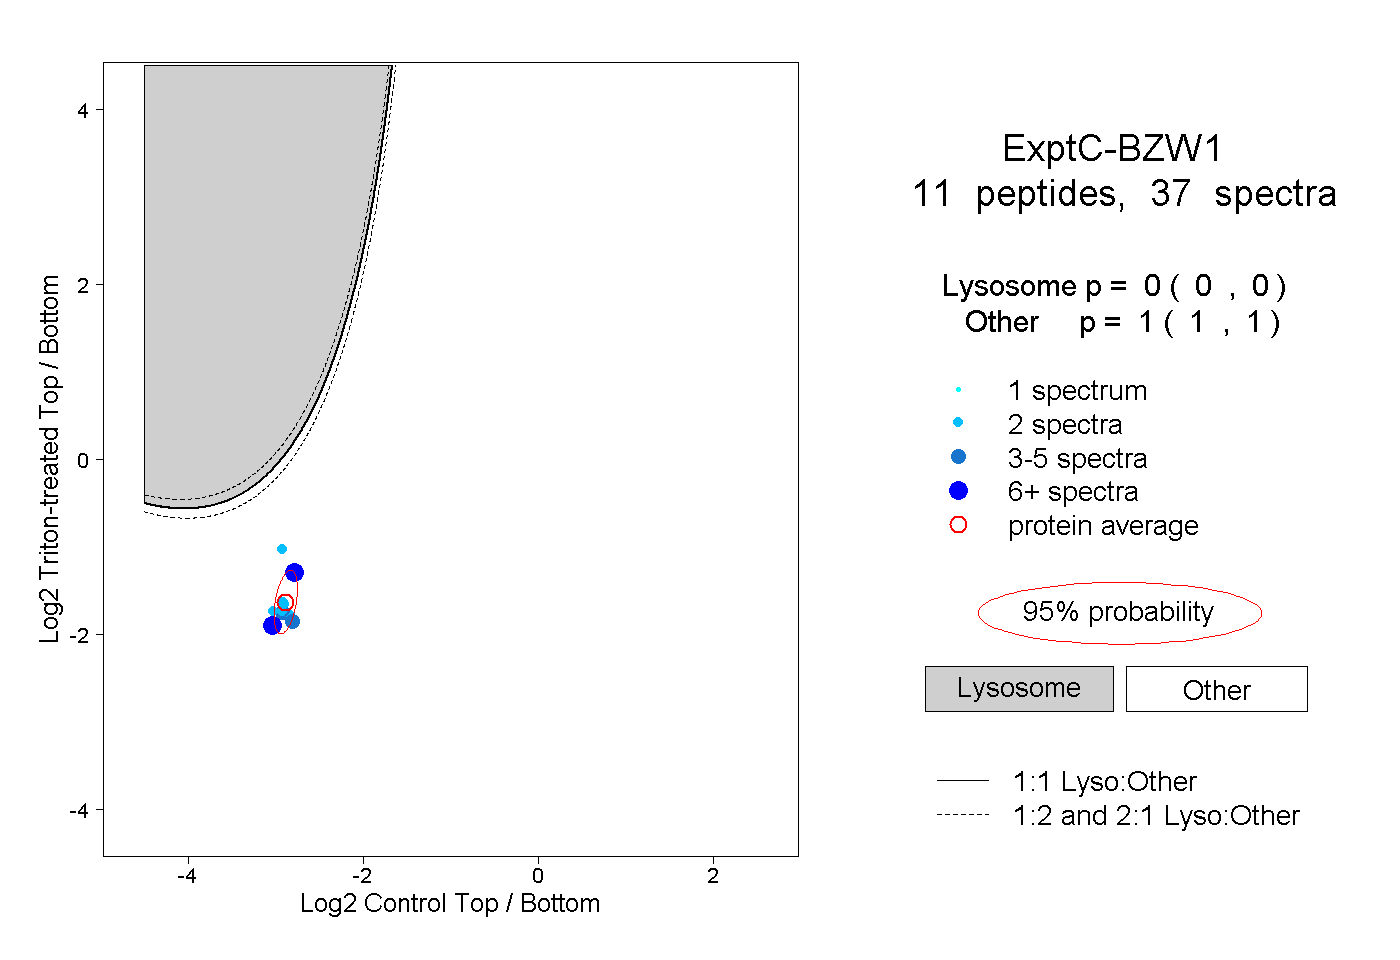
| Expt C |
11
peptides |
37
spectra |
 |
|
0.000
0.000 | 0.000 |
|
|
|
|
|
|
|
1.000
1.000 | 1.000 |
| | | Plot |
|
Lyso |
|
|
|
|
|
|
|
Other |
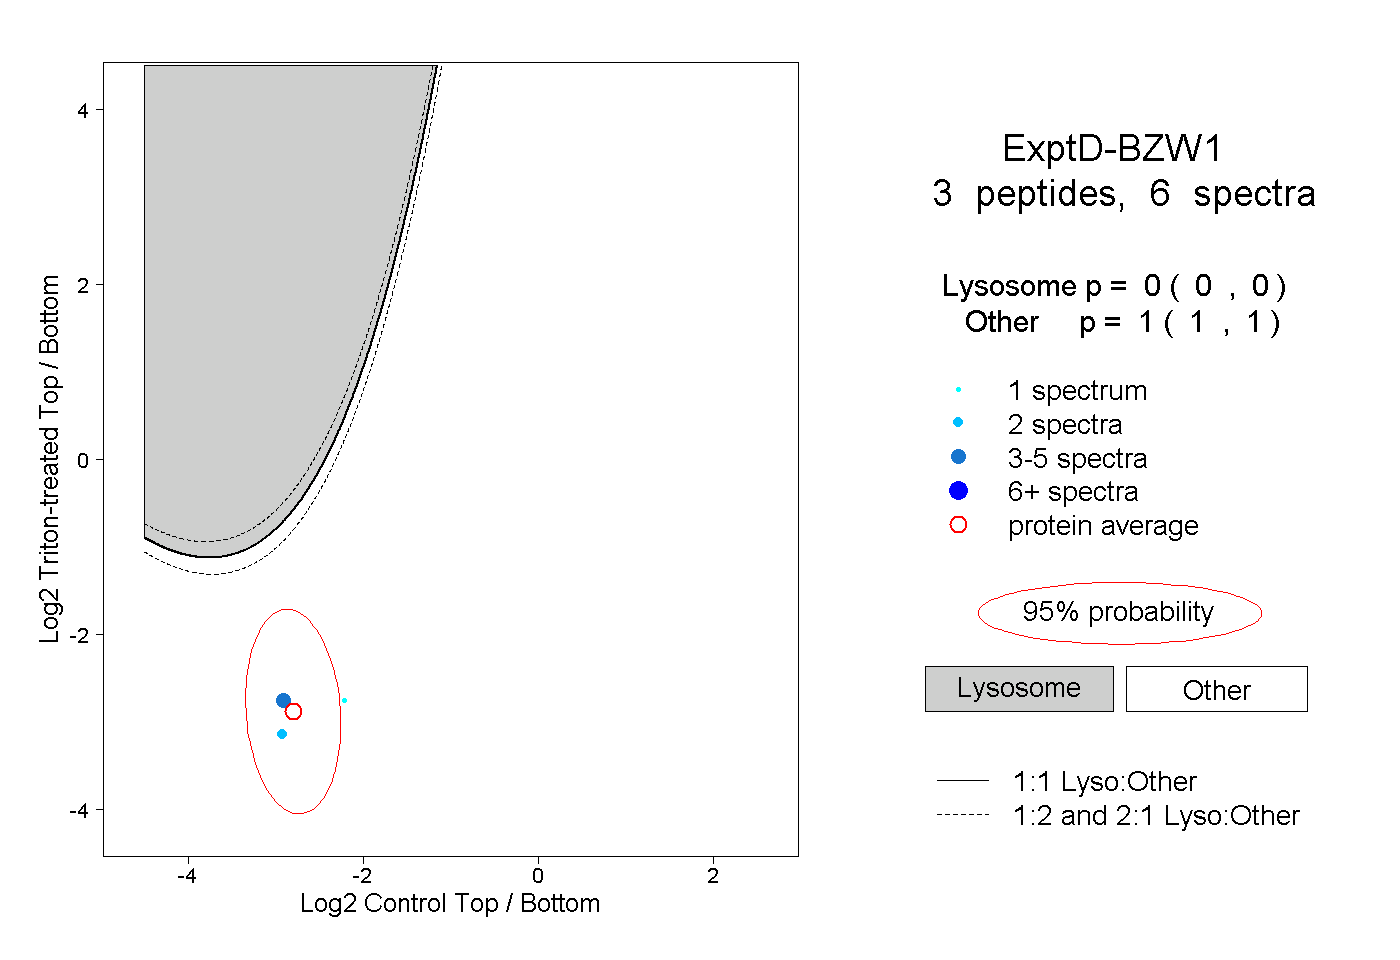
| Expt D |
3
peptides |
6
spectra |
 |
|
0.000
0.000 | 0.000 |
|
|
|
|
|
|
|
1.000
1.000 | 1.000 |