 20
20peptides
spectra
0.000 | 0.000
0.000 | 0.000
0.000 | 0.000
0.000 | 0.000
0.276 | 0.281
0.000 | 0.000
0.587 | 0.590
0.129 | 0.135
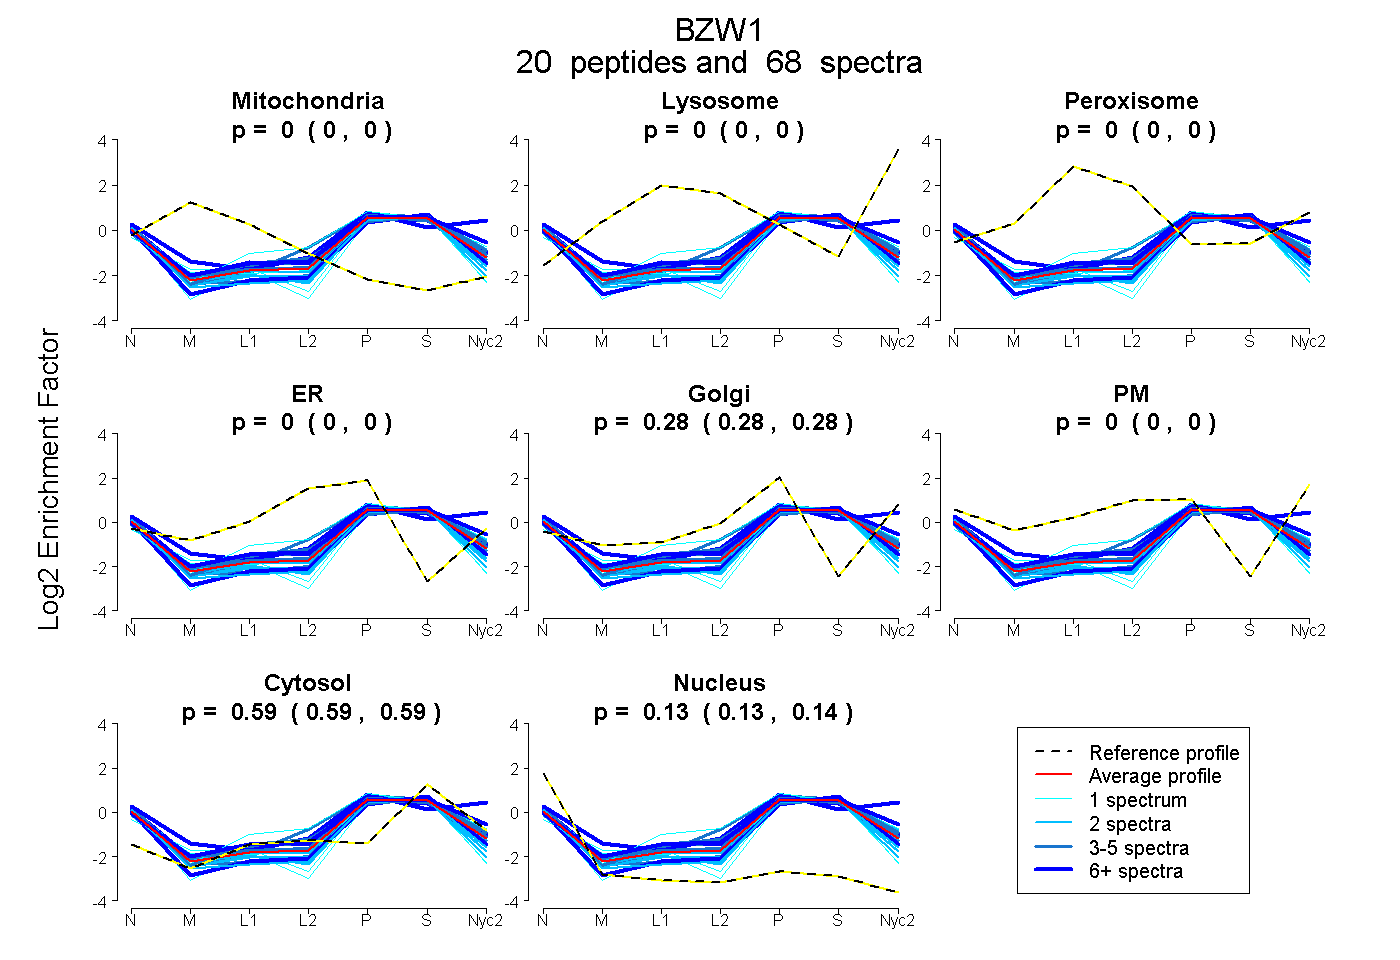
| Plot | Mito | Lyso | Perox | ER | Golgi | PM | Cytosol | Nucleus | |||||
| Expt A |
20 peptides |
68 spectra |
|
0.000 0.000 | 0.000 |
0.000 0.000 | 0.000 |
0.000 0.000 | 0.000 |
0.000 0.000 | 0.000 |
0.279 0.276 | 0.281 |
0.000 0.000 | 0.000 |
0.589 0.587 | 0.590 |
0.133 0.129 | 0.135 |
| 8 spectra, VSMDNR | 0.000 | 0.000 | 0.000 | 0.000 | 0.347 | 0.000 | 0.611 | 0.042 | ||
| 2 spectra, EGVSAAFAVK | 0.000 | 0.000 | 0.000 | 0.000 | 0.253 | 0.000 | 0.616 | 0.132 | ||
| 2 spectra, DINAVAASLR | 0.000 | 0.000 | 0.000 | 0.000 | 0.189 | 0.000 | 0.595 | 0.217 | ||
| 2 spectra, LMELFPANK | 0.000 | 0.000 | 0.000 | 0.000 | 0.245 | 0.000 | 0.597 | 0.158 | ||
| 9 spectra, NQQTIGAR | 0.000 | 0.000 | 0.000 | 0.000 | 0.481 | 0.034 | 0.469 | 0.017 | ||
| 4 spectra, DAHVAK | 0.000 | 0.000 | 0.000 | 0.097 | 0.216 | 0.000 | 0.608 | 0.079 | ||
| 8 spectra, ELQEQMSR | 0.000 | 0.000 | 0.000 | 0.000 | 0.339 | 0.000 | 0.556 | 0.104 | ||
| 8 spectra, IVVLFYK | 0.000 | 0.000 | 0.000 | 0.000 | 0.166 | 0.000 | 0.639 | 0.195 | ||
| 1 spectrum, EELVAEQALK | 0.000 | 0.000 | 0.000 | 0.000 | 0.147 | 0.000 | 0.582 | 0.270 | ||
| 2 spectra, SWINEK | 0.000 | 0.000 | 0.000 | 0.000 | 0.155 | 0.000 | 0.589 | 0.255 | ||
| 3 spectra, GFSESER | 0.000 | 0.000 | 0.000 | 0.000 | 0.301 | 0.000 | 0.597 | 0.102 | ||
| 2 spectra, GFEDEVK | 0.000 | 0.000 | 0.000 | 0.000 | 0.227 | 0.000 | 0.617 | 0.156 | ||
| 2 spectra, DIILYVK | 0.000 | 0.000 | 0.000 | 0.122 | 0.165 | 0.000 | 0.585 | 0.129 | ||
| 1 spectrum, AEVLSEEPILK | 0.000 | 0.000 | 0.000 | 0.000 | 0.201 | 0.000 | 0.621 | 0.178 | ||
| 1 spectrum, QQKPTLSGQR | 0.000 | 0.000 | 0.000 | 0.174 | 0.202 | 0.000 | 0.606 | 0.018 | ||
| 1 spectrum, FLDASGAK | 0.000 | 0.000 | 0.000 | 0.000 | 0.317 | 0.000 | 0.559 | 0.124 | ||
| 4 spectra, FVEWLK | 0.000 | 0.000 | 0.000 | 0.000 | 0.249 | 0.000 | 0.540 | 0.210 | ||
| 3 spectra, SAFLEQMK | 0.000 | 0.000 | 0.000 | 0.000 | 0.302 | 0.000 | 0.588 | 0.110 | ||
| 4 spectra, QSVEHFTK | 0.000 | 0.000 | 0.000 | 0.000 | 0.293 | 0.000 | 0.622 | 0.086 | ||
| 1 spectrum, IQEYCYDNIHFMK | 0.000 | 0.000 | 0.000 | 0.150 | 0.031 | 0.000 | 0.648 | 0.171 |
| Plot | Mito | Lyso or Perox | ER | Golgi | PM | Cytosol | Nucleus | ||||||
| Expt B |
11 peptides |
23 spectra |
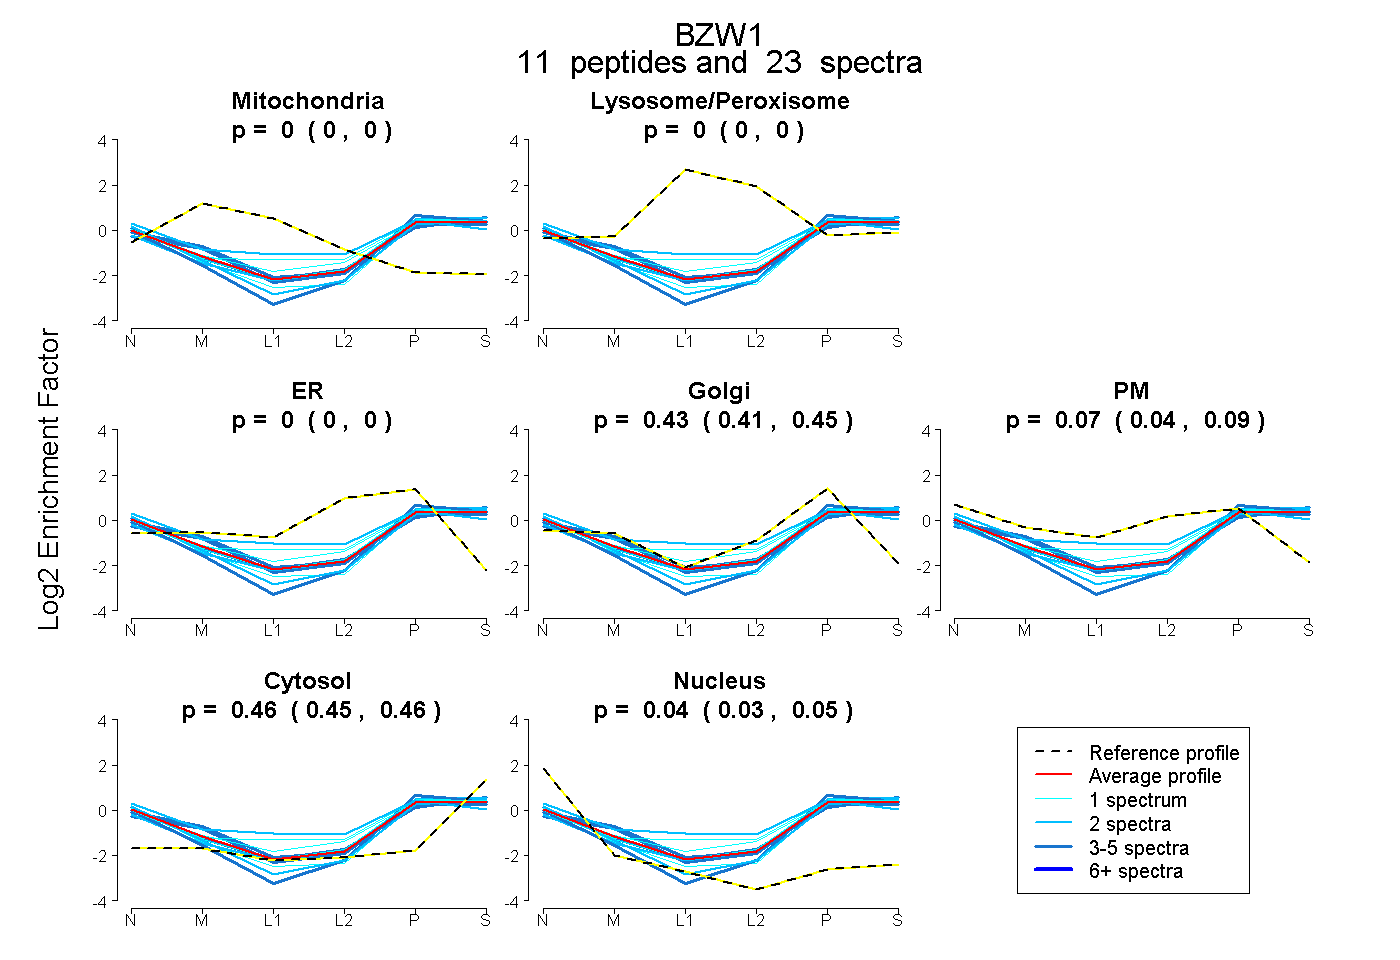 |
0.000 0.000 | 0.000 |
0.000 0.000 | 0.000 |
0.000 0.000 | 0.000 |
0.433 0.411 | 0.454 |
0.067 0.040 | 0.089 |
0.457 0.452 | 0.462 |
0.042 0.035 | 0.049 |
|||
| Plot | Lyso | Other | |||||||||||
| Expt C |
11 peptides |
37 spectra |
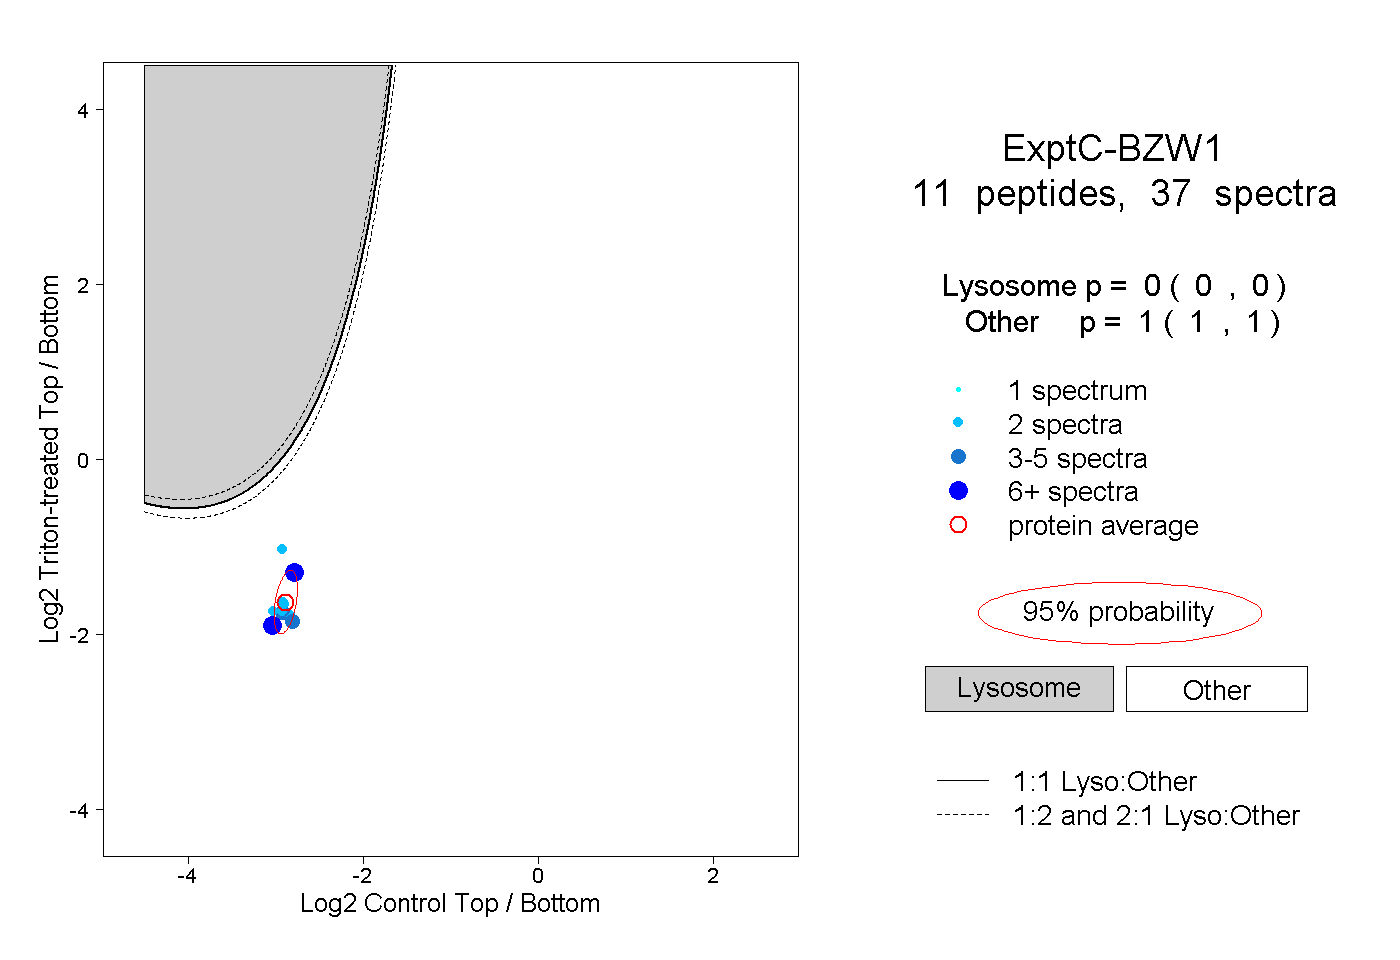 |
0.000 0.000 | 0.000 |
1.000 1.000 | 1.000 |
||||||||
| Plot | Lyso | Other | |||||||||||
| Expt D |
3 peptides |
6 spectra |
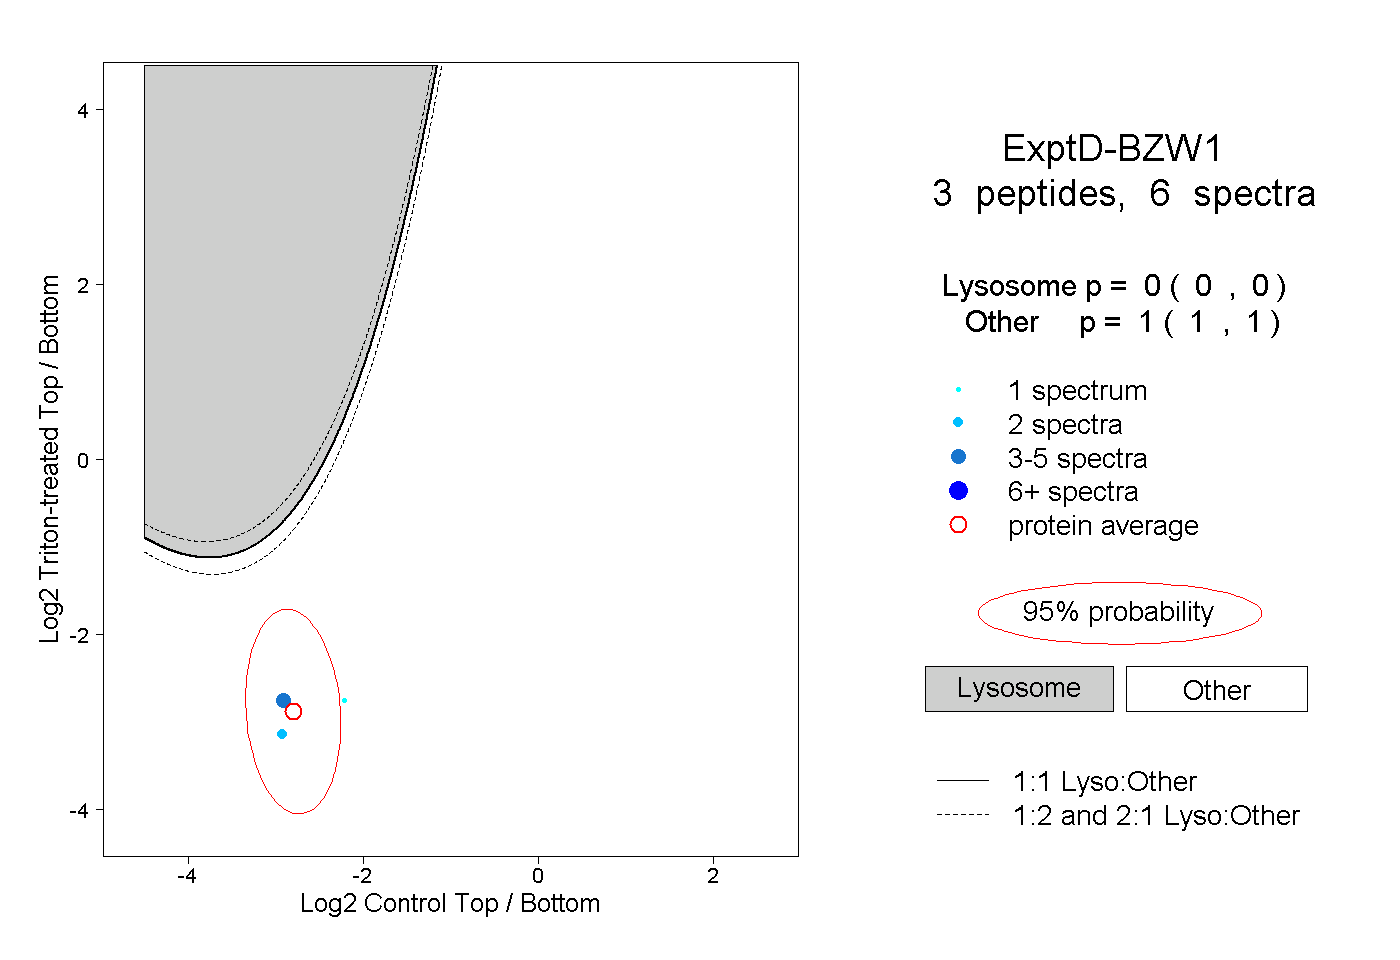 |
0.000 0.000 | 0.000 |
1.000 1.000 | 1.000 |