 1
1peptide
spectra
0.000 | 0.008
0.145 | 0.399
0.000 | 0.202
0.000 | 0.000
0.000 | 0.140
0.000 | 0.315
0.345 | 0.462
0.000 | 0.000
2peptides
spectra
0.000 | 0.000
1.000 | 1.000
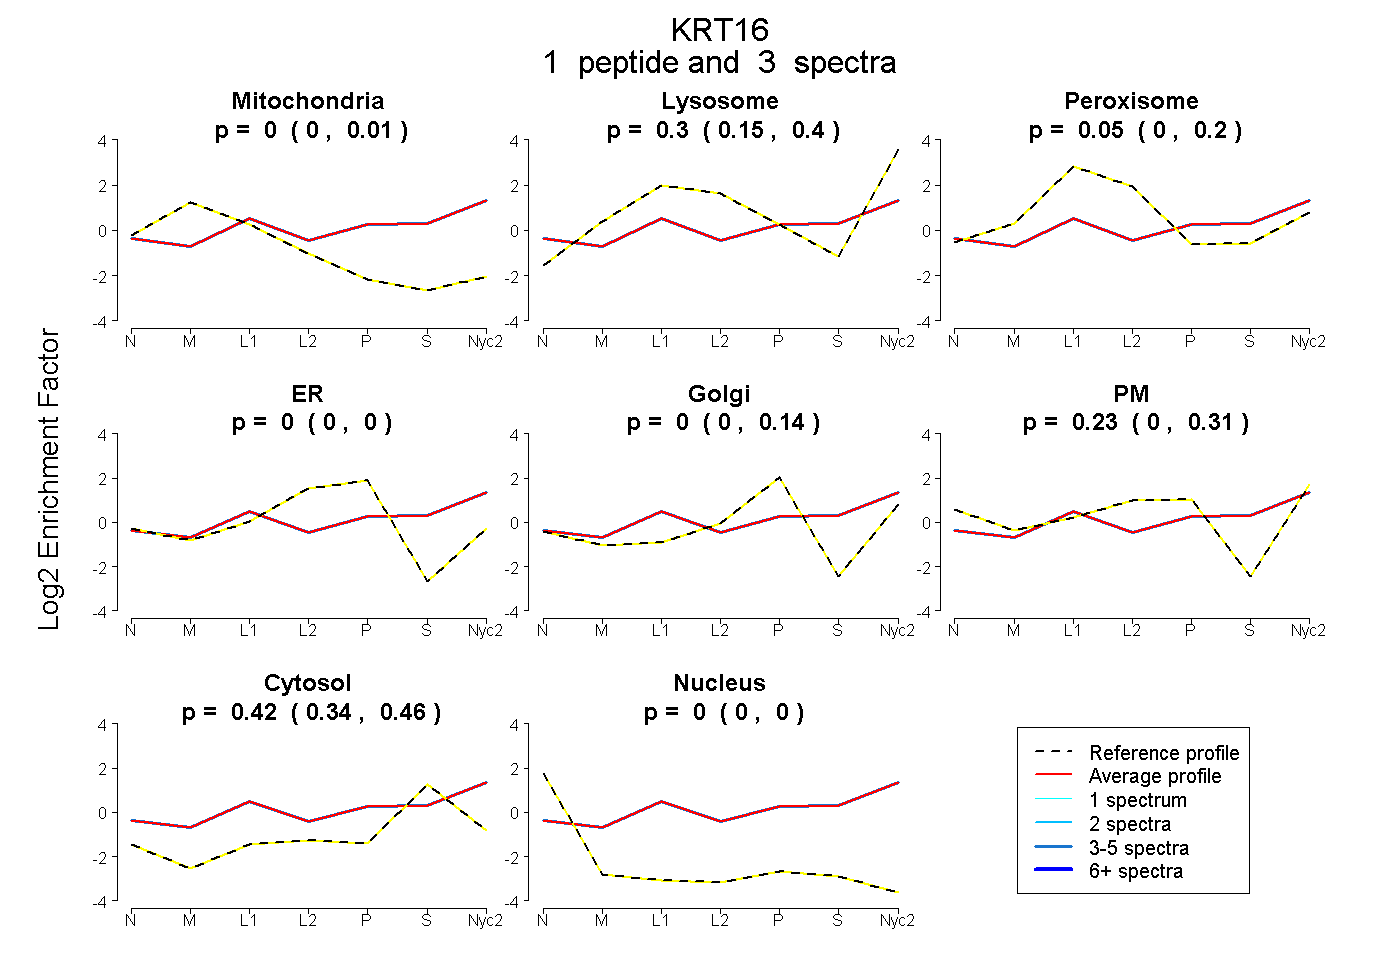
| Plot | Mito | Lyso | Perox | ER | Golgi | PM | Cytosol | Nucleus | |||||
| Expt A |
1 peptide |
3 spectra |
|
0.000 0.000 | 0.008 |
0.298 0.145 | 0.399 |
0.050 0.000 | 0.202 |
0.000 0.000 | 0.000 |
0.000 0.000 | 0.140 |
0.233 0.000 | 0.315 |
0.419 0.345 | 0.462 |
0.000 0.000 | 0.000 |
||
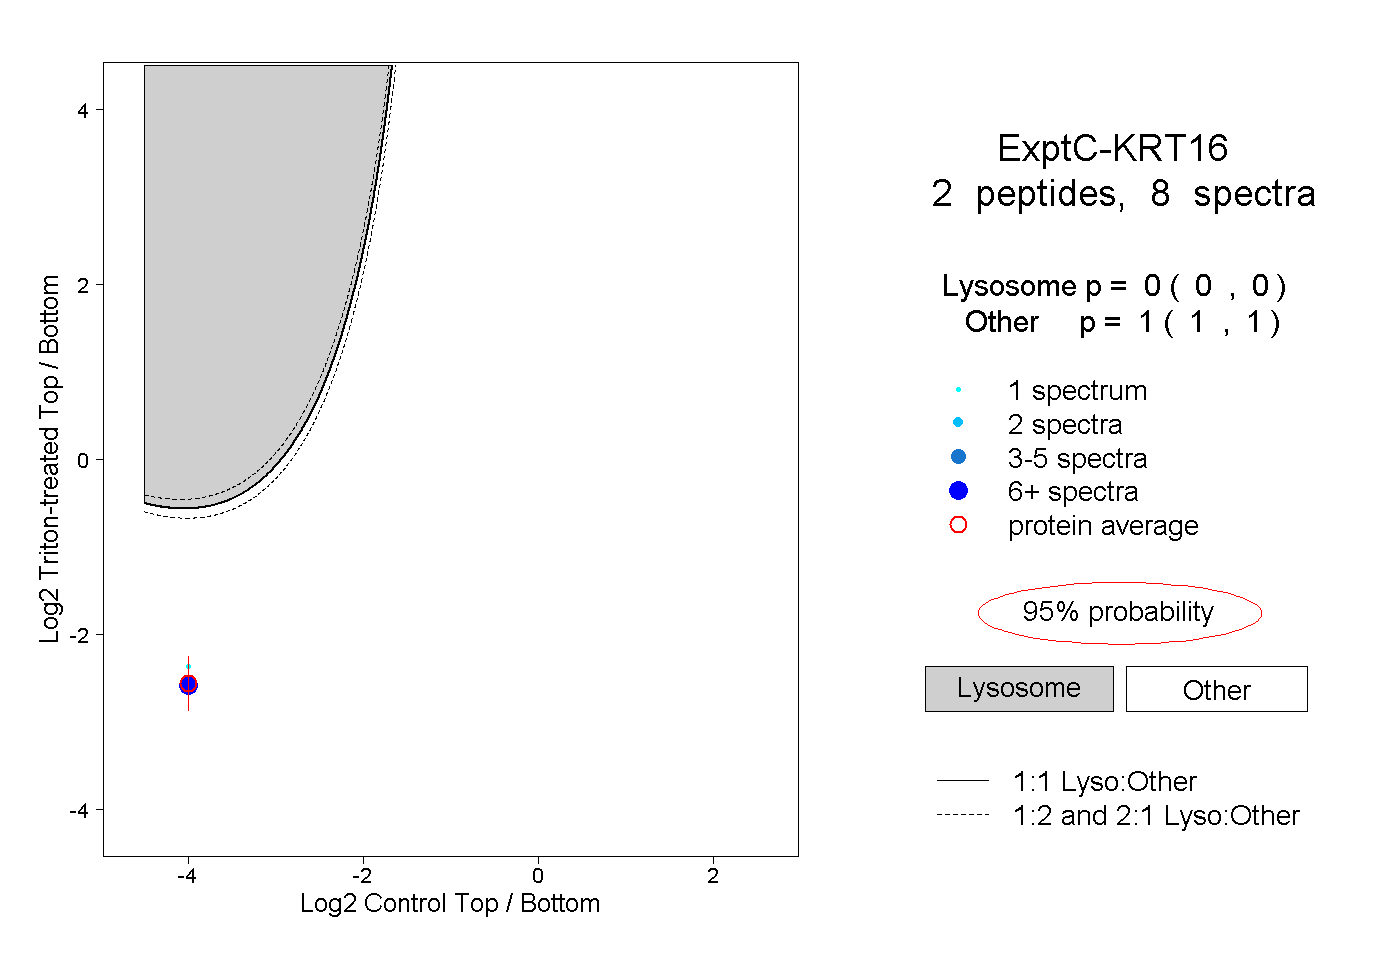
| Plot | Lyso | Other | |||||||||||
| Expt C |
2 peptides |
8 spectra |
|
0.000 0.000 | 0.000 |
1.000 1.000 | 1.000 |