 1
1peptide
spectra
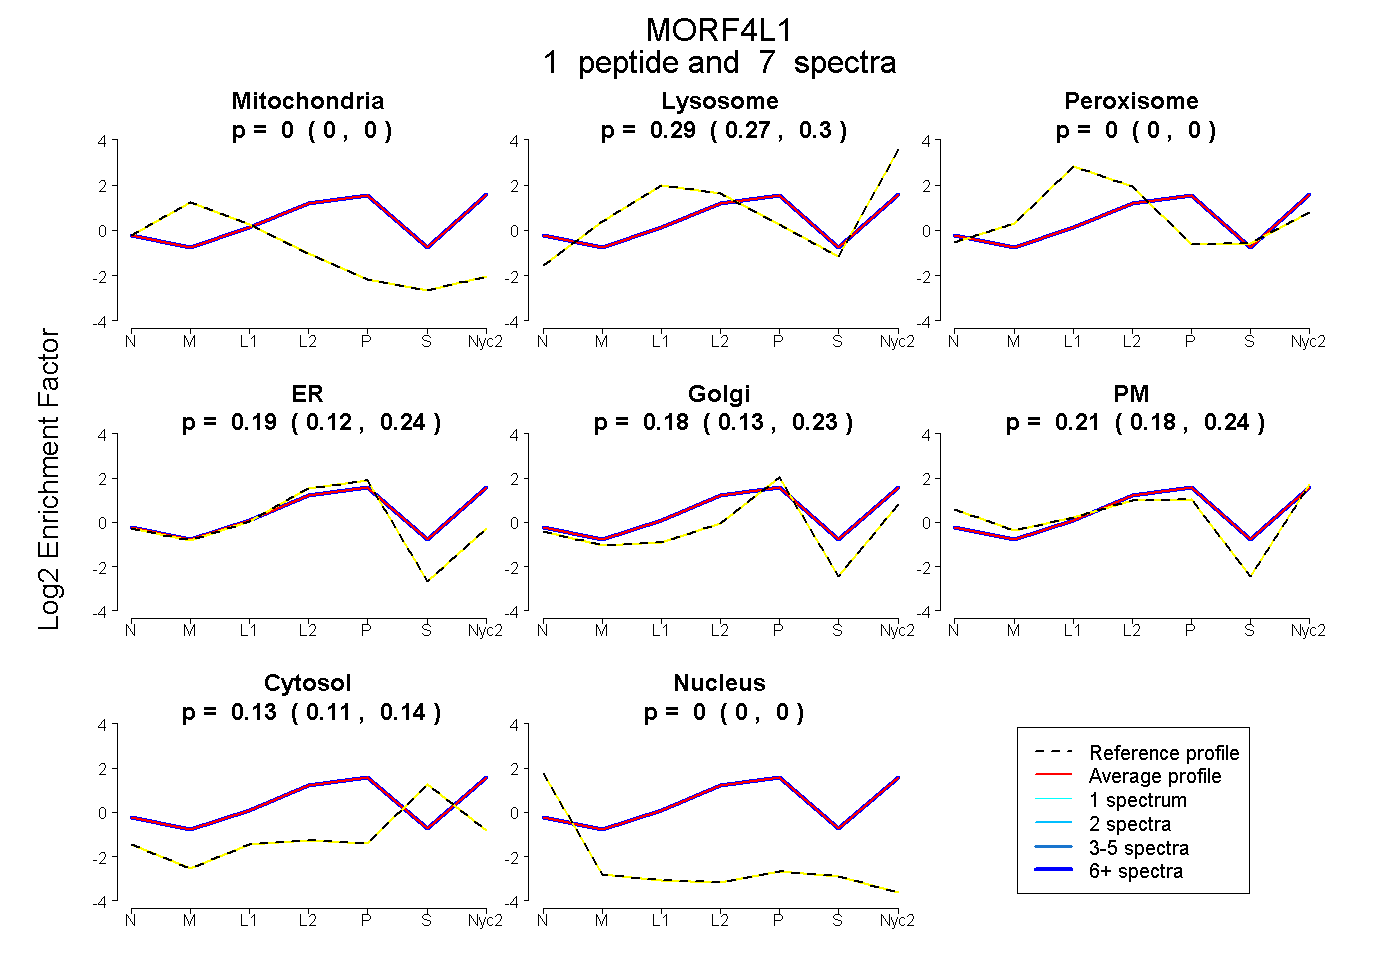
0.000 | 0.000
0.266 | 0.304
0.000 | 0.000
0.124 | 0.239
0.128 | 0.231
0.179 | 0.245
0.114 | 0.135
0.000 | 0.000
1peptide
spectra
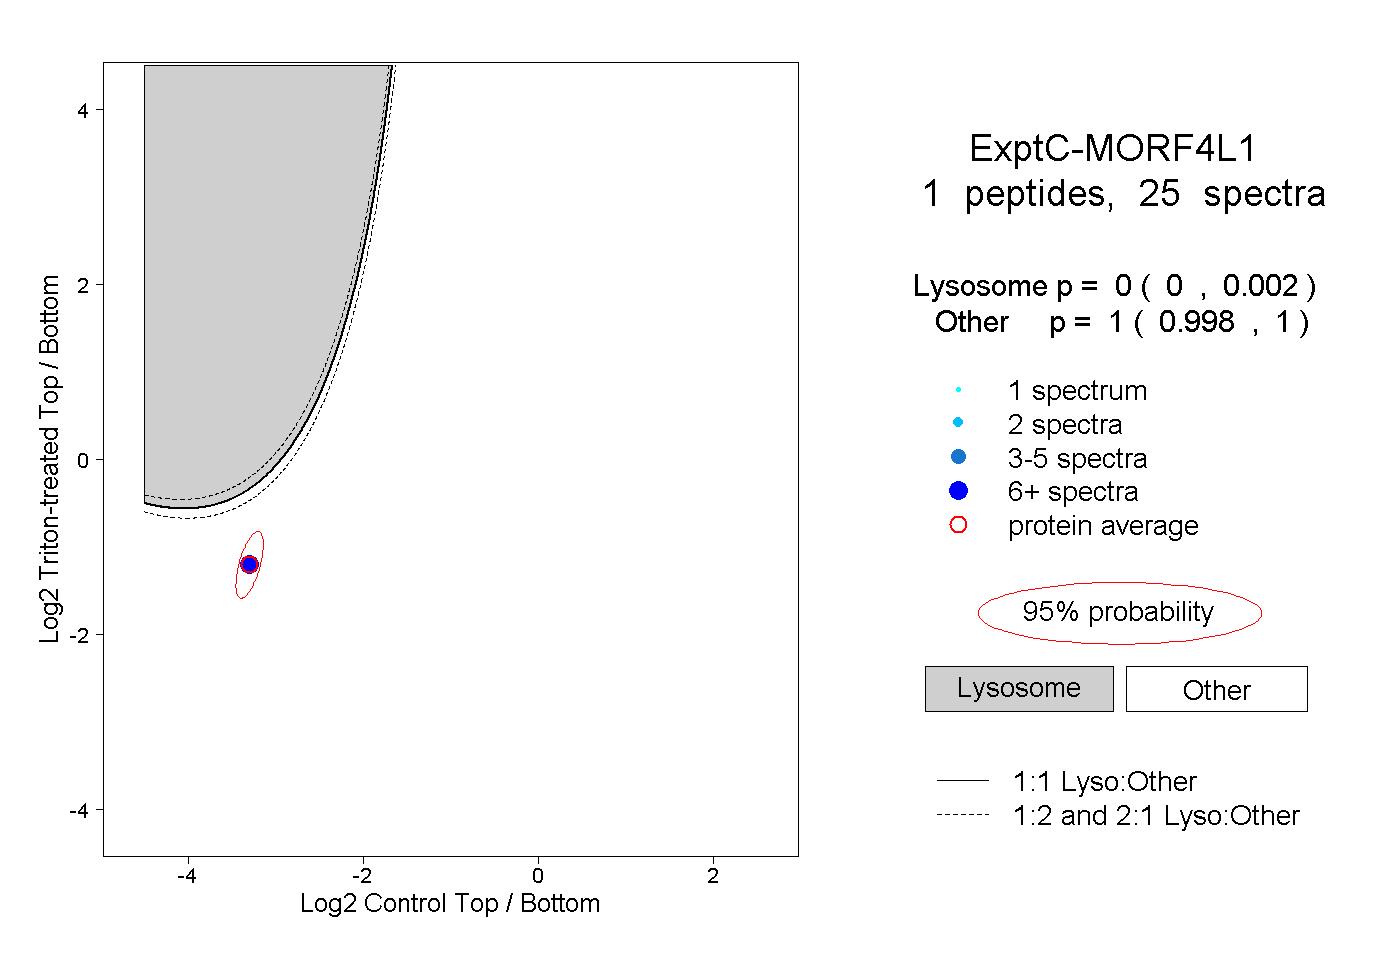
0.000 | 0.002
0.998 | 1.000
1peptide
spectra
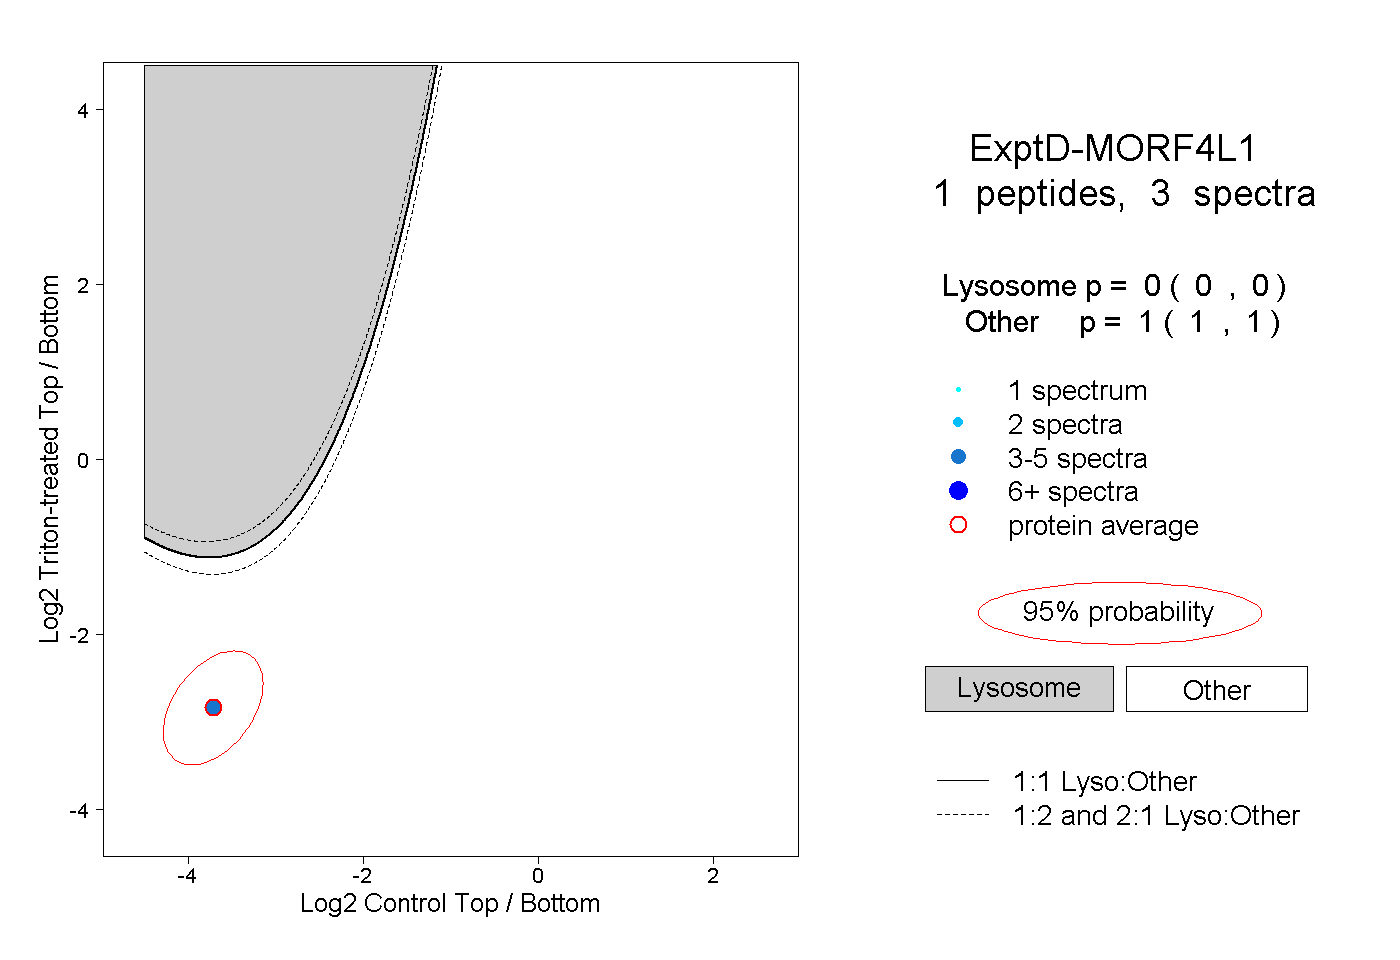
0.000 | 0.000
1.000 | 1.000