 24
24peptides
spectra
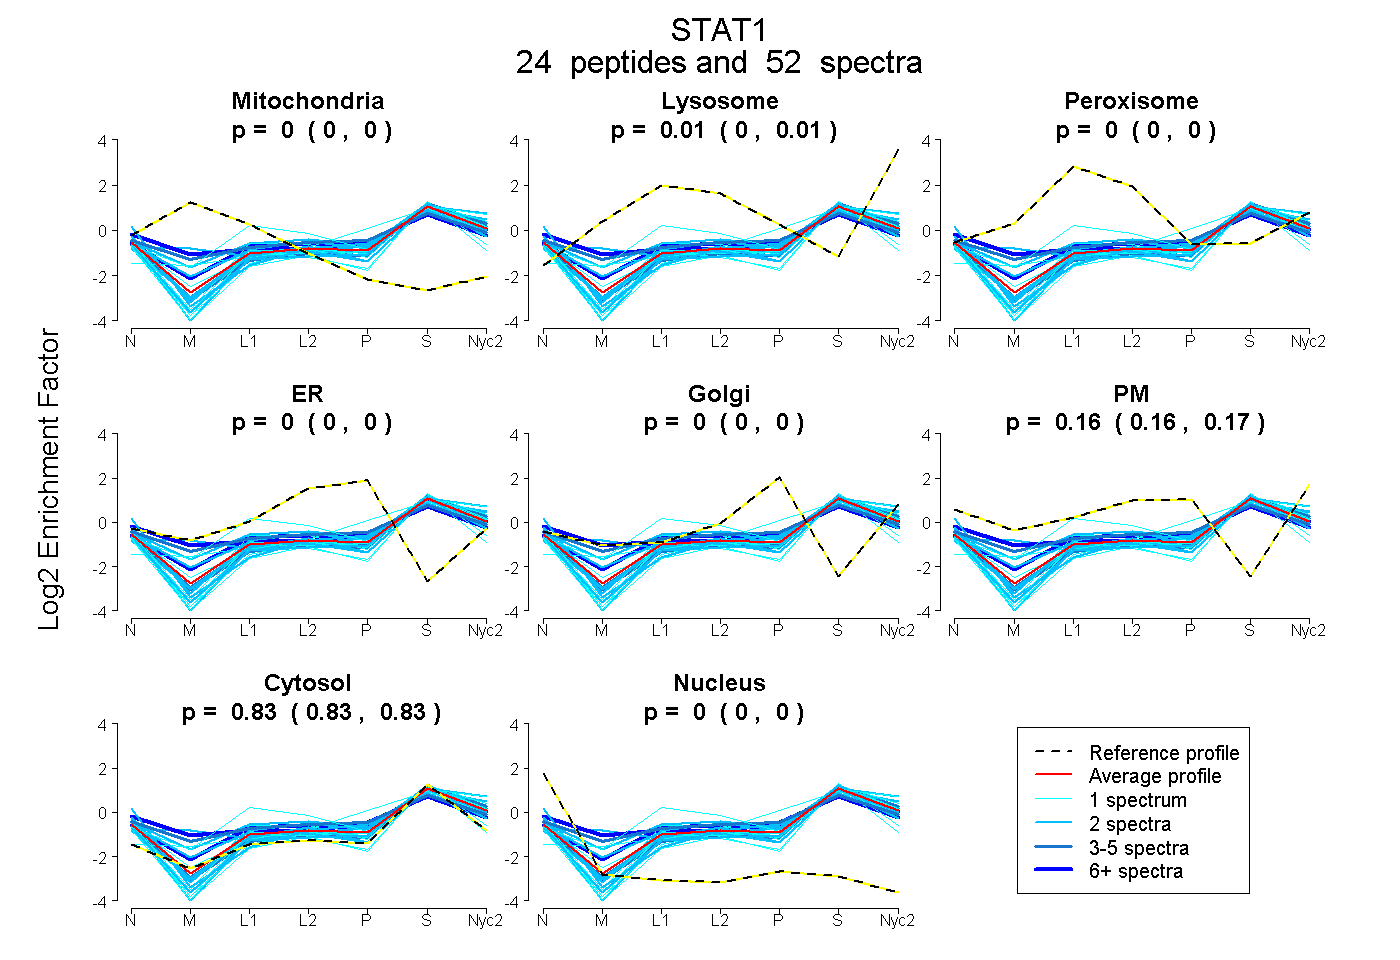
0.000 | 0.000
0.000 | 0.009
0.000 | 0.000
0.000 | 0.000
0.000 | 0.000
0.159 | 0.166
0.828 | 0.835
0.000 | 0.000
5peptides
spectra
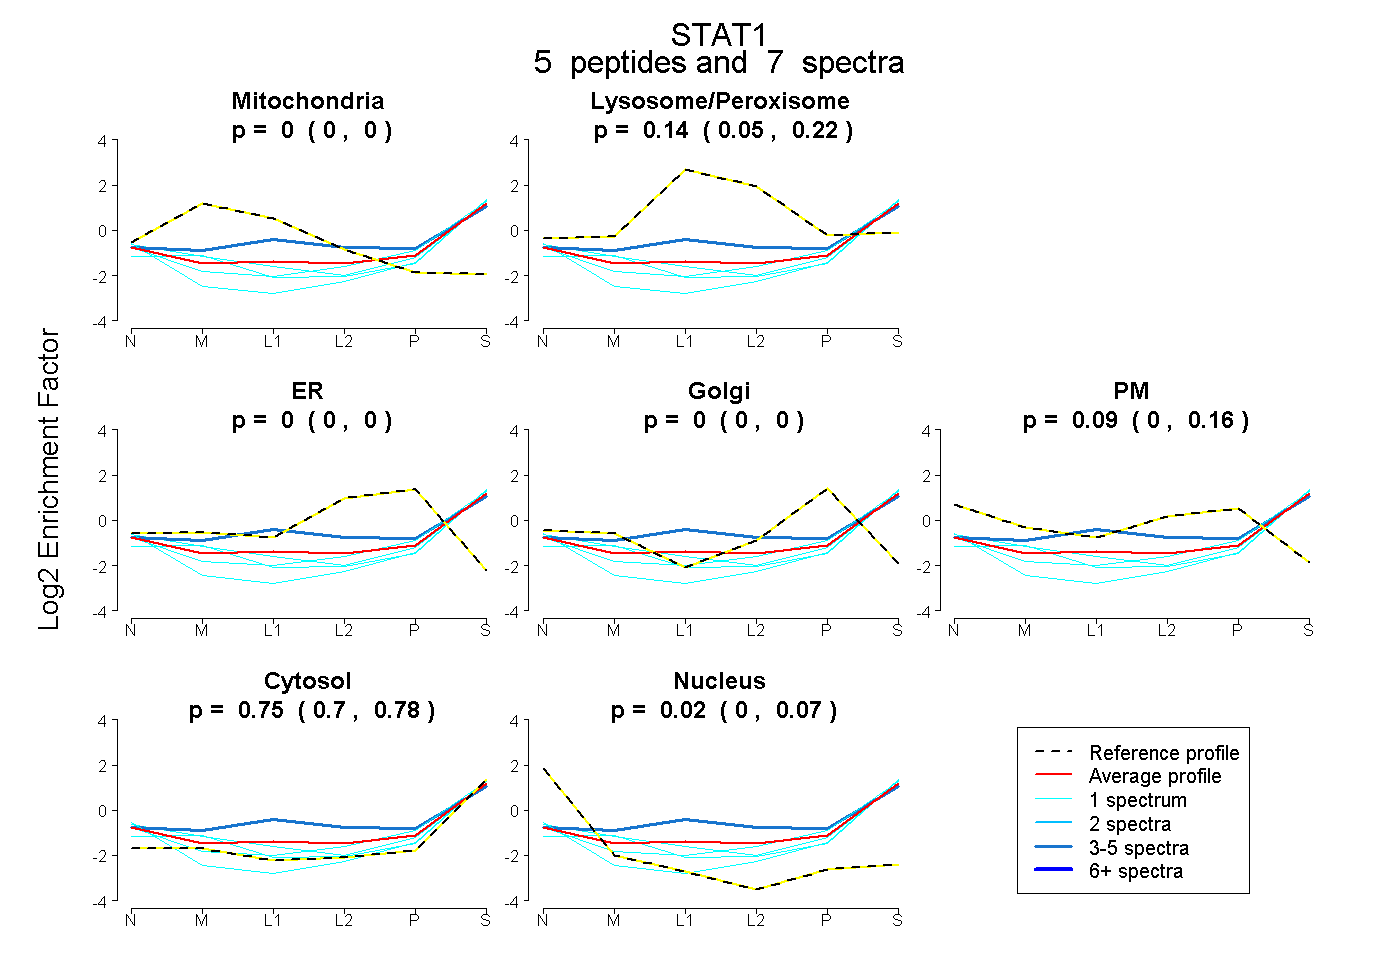
0.000 | 0.000
0.045 | 0.220
0.000 | 0.000
0.000 | 0.000
0.000 | 0.163
0.702 | 0.784
0.000 | 0.066
20peptides
spectra
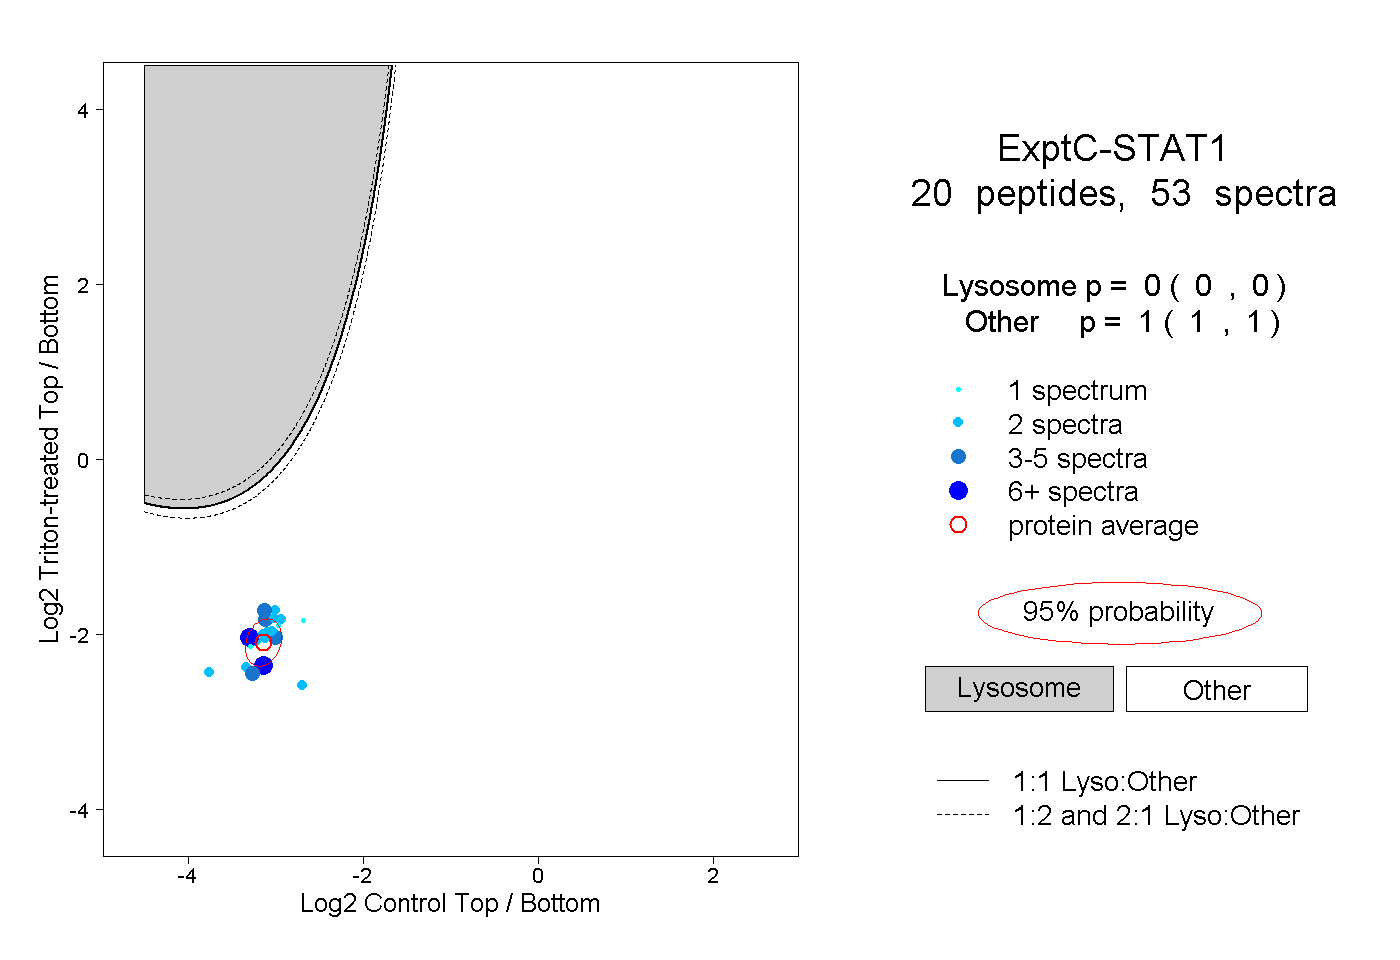
0.000 | 0.000
1.000 | 1.000
2peptides
spectra
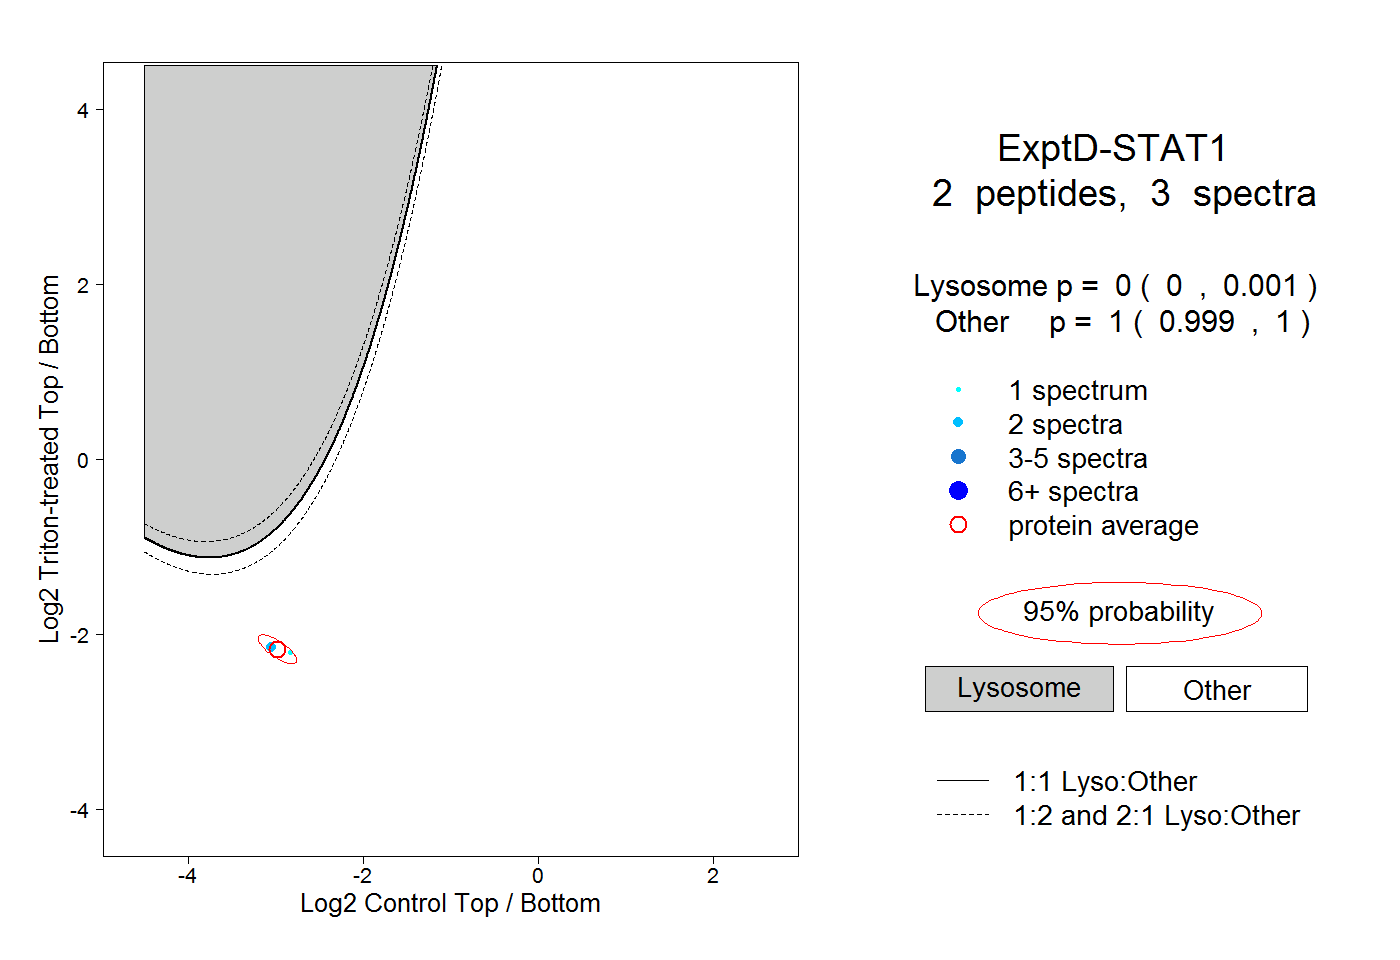
0.000 | 0.001
0.999 | 1.000