 3
3peptides
spectra
0.000 | 0.135
0.000 | 0.000
0.000 | 0.109
0.000 | 0.258
0.000 | 0.243
0.000 | 0.320
0.064 | 0.418
0.259 | 0.471
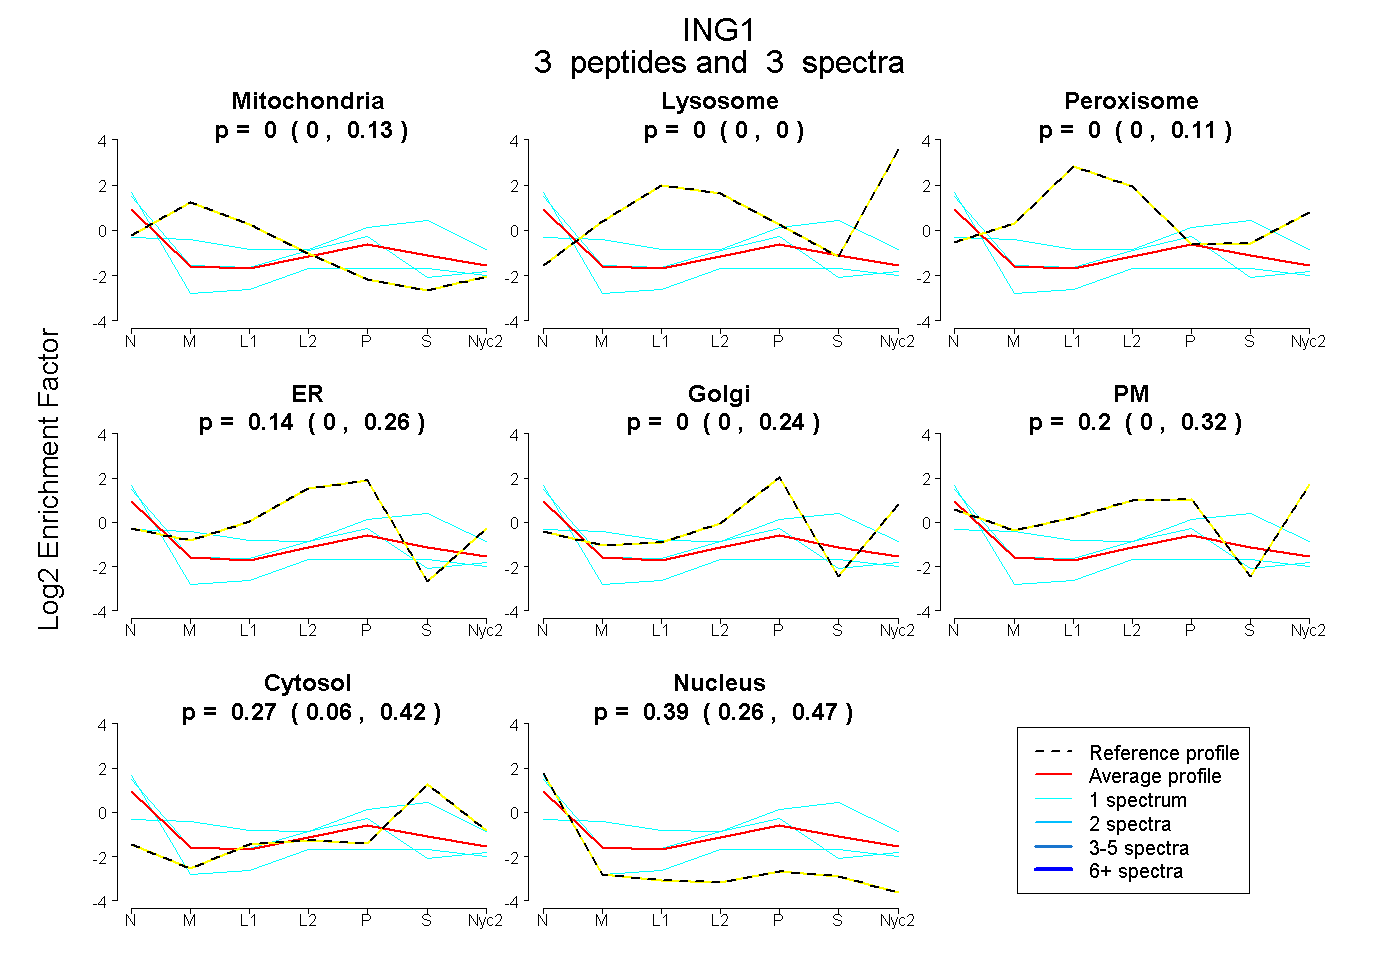
| Plot | Mito | Lyso | Perox | ER | Golgi | PM | Cytosol | Nucleus | |||||
| Expt A |
3 peptides |
3 spectra |
|
0.000 0.000 | 0.135 |
0.000 0.000 | 0.000 |
0.000 0.000 | 0.109 |
0.138 0.000 | 0.258 |
0.000 0.000 | 0.243 |
0.202 0.000 | 0.320 |
0.273 0.064 | 0.418 |
0.388 0.259 | 0.471 |
| 1 spectrum, SQELGDEK | 0.169 | 0.000 | 0.079 | 0.000 | 0.259 | 0.000 | 0.493 | 0.000 | ||
| 1 spectrum, VLHCIQR | 0.000 | 0.000 | 0.000 | 0.296 | 0.000 | 0.179 | 0.029 | 0.496 | ||
| 1 spectrum, ELDDYYEK | 0.000 | 0.000 | 0.000 | 0.000 | 0.000 | 0.171 | 0.186 | 0.643 |