 9
9peptides
spectra
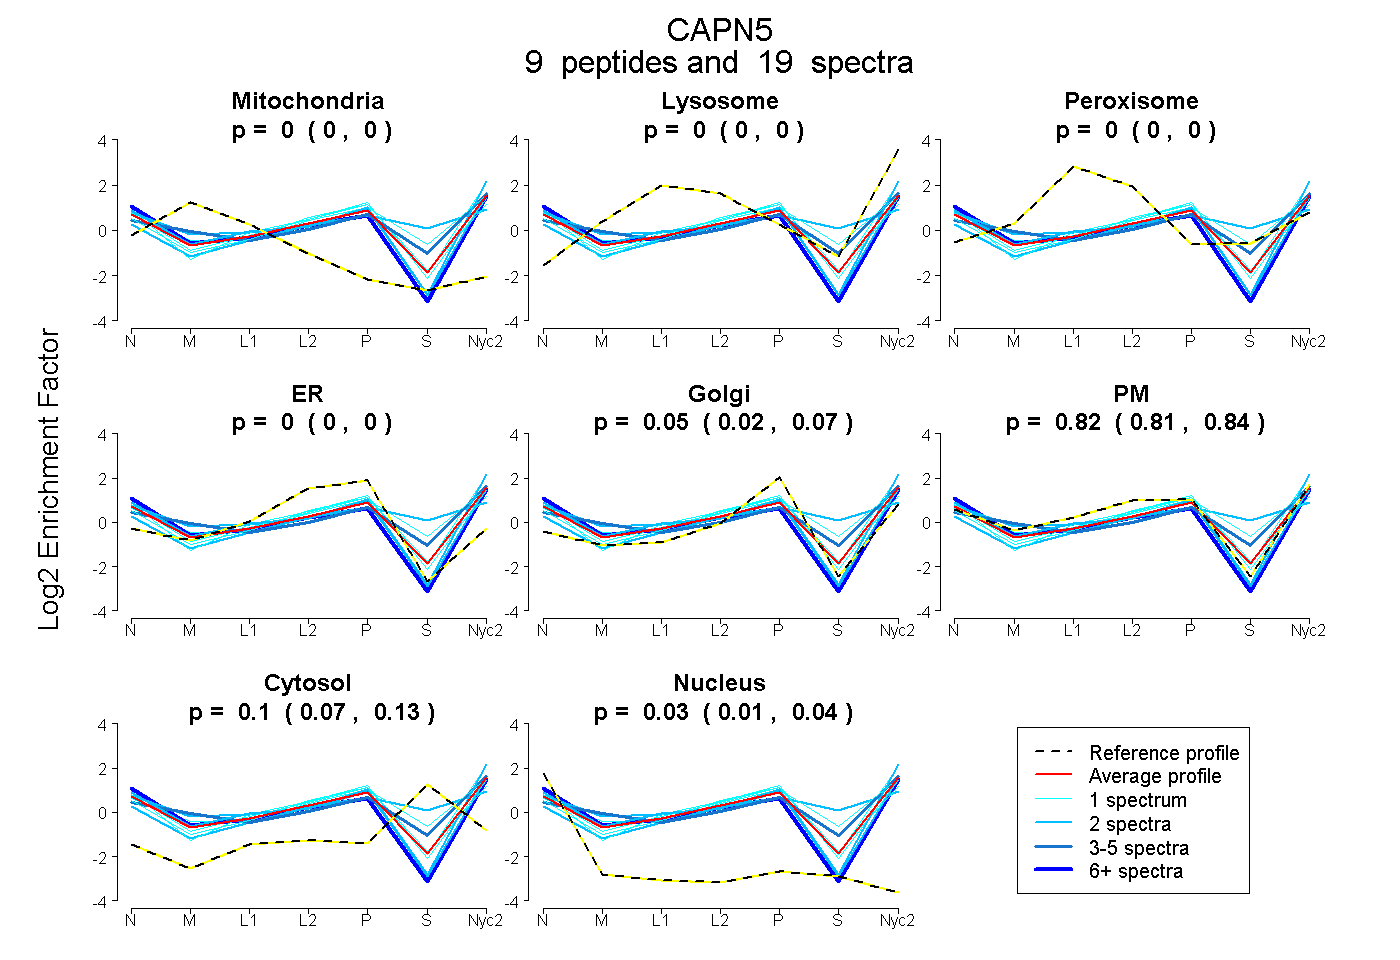
0.000 | 0.000
0.000 | 0.000
0.000 | 0.000
0.000 | 0.000
0.023 | 0.070
0.806 | 0.837
0.069 | 0.131
0.010 | 0.039
| Plot | Mito | Lyso | Perox | ER | Golgi | PM | Cytosol | Nucleus | |||||
| Expt A |
9 peptides |
19 spectra |
|
0.000 0.000 | 0.000 |
0.000 0.000 | 0.000 |
0.000 0.000 | 0.000 |
0.000 0.000 | 0.000 |
0.050 0.023 | 0.070 |
0.822 0.806 | 0.837 |
0.103 0.069 | 0.131 |
0.026 0.010 | 0.039 |
| 1 spectrum, FGEWVDVVVDDR | 0.000 | 0.011 | 0.000 | 0.000 | 0.092 | 0.848 | 0.049 | 0.000 | ||
| 2 spectra, LDEPPR | 0.000 | 0.031 | 0.004 | 0.000 | 0.000 | 0.556 | 0.410 | 0.000 | ||
| 2 spectra, GTPGPTVR | 0.025 | 0.000 | 0.000 | 0.000 | 0.056 | 0.868 | 0.000 | 0.051 | ||
| 6 spectra, GIFYR | 0.000 | 0.000 | 0.000 | 0.000 | 0.000 | 0.886 | 0.000 | 0.114 | ||
| 2 spectra, YVIIPTTFEPGHTGEFLLR | 0.000 | 0.000 | 0.000 | 0.000 | 0.041 | 0.926 | 0.000 | 0.033 | ||
| 1 spectrum, VFTDVPSNCR | 0.000 | 0.020 | 0.000 | 0.000 | 0.001 | 0.725 | 0.255 | 0.000 | ||
| 1 spectrum, LSQPITVQVWNHR | 0.000 | 0.000 | 0.000 | 0.000 | 0.118 | 0.754 | 0.097 | 0.032 | ||
| 1 spectrum, LGHGLLAFFK | 0.000 | 0.000 | 0.000 | 0.000 | 0.151 | 0.764 | 0.038 | 0.047 | ||
| 3 spectra, TELPEGR | 0.000 | 0.045 | 0.000 | 0.000 | 0.000 | 0.739 | 0.216 | 0.000 |
| Plot | Lyso | Other | |||||||||||
| Expt C |
6 peptides |
14 spectra |
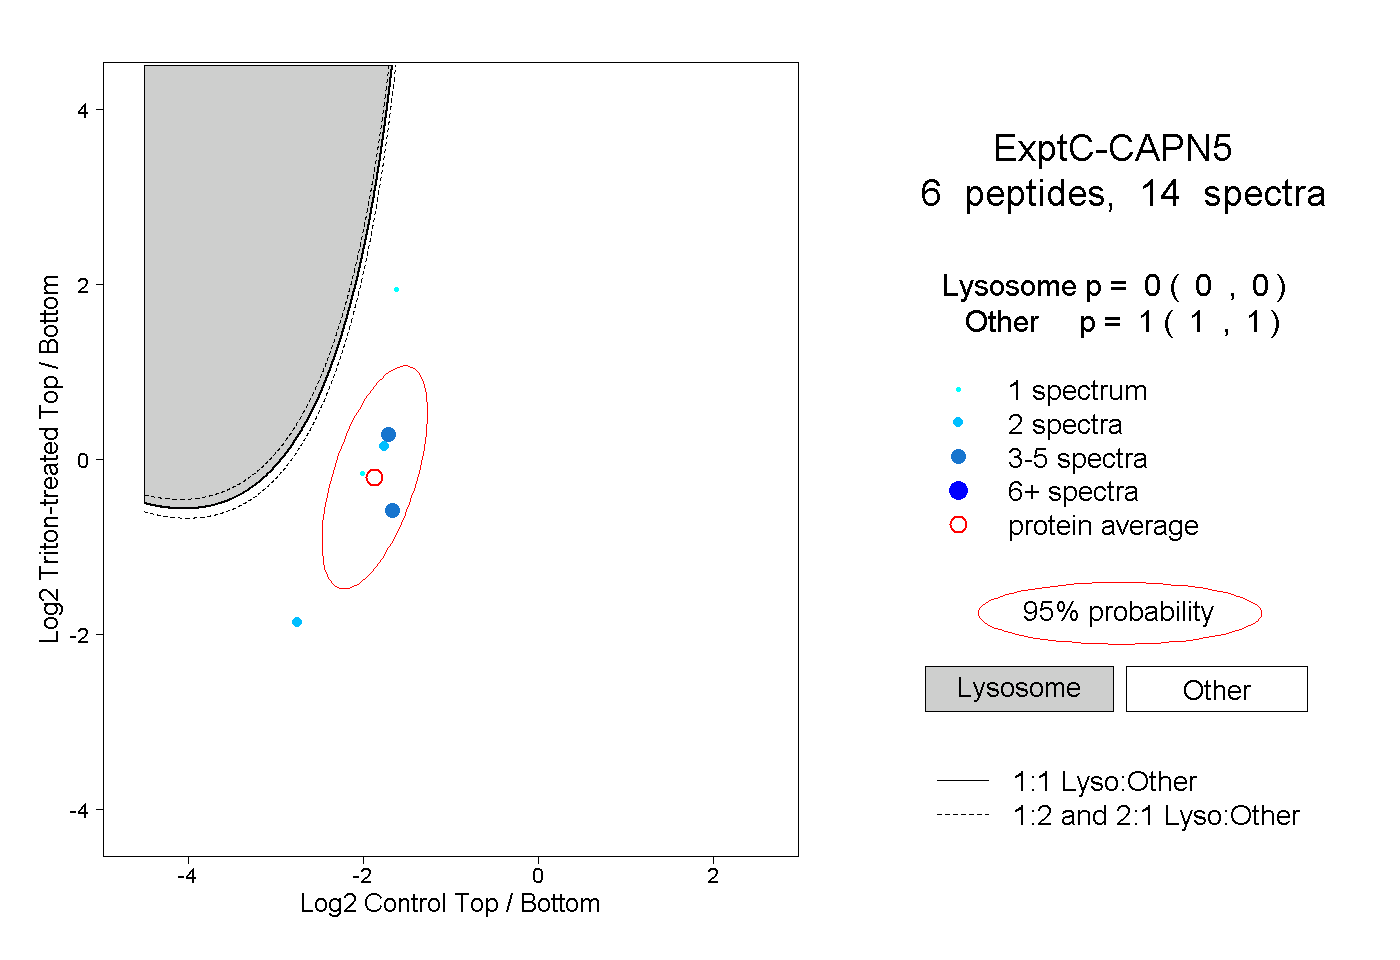 |
0.000 0.000 | 0.000 |
1.000 1.000 | 1.000 |