 9
9peptides
spectra
0.000 | 0.000
0.000 | 0.000
0.000 | 0.000
0.000 | 0.119
0.000 | 0.116
0.000 | 0.000
0.345 | 0.383
0.493 | 0.533
| Plot | Mito | Lyso | Perox | ER | Golgi | PM | Cytosol | Nucleus | |||||
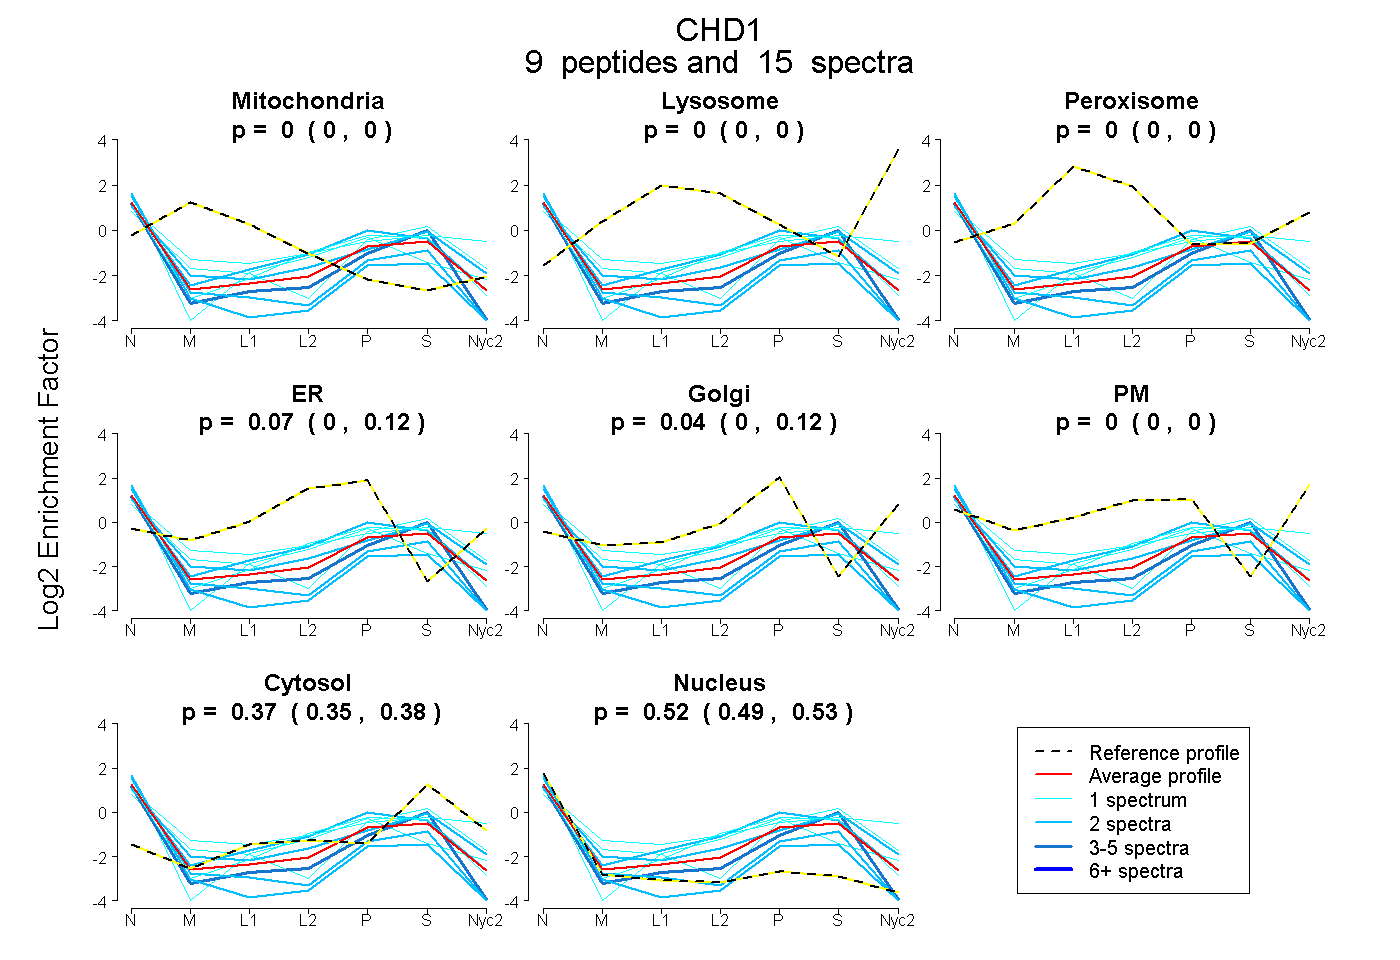
| Expt A |
9 peptides |
15 spectra |
|
0.000 0.000 | 0.000 |
0.000 0.000 | 0.000 |
0.000 0.000 | 0.000 |
0.073 0.000 | 0.119 |
0.044 0.000 | 0.116 |
0.000 0.000 | 0.000 |
0.367 0.345 | 0.383 |
0.516 0.493 | 0.533 |
| 1 spectrum, IIAHSNQK | 0.000 | 0.000 | 0.000 | 0.000 | 0.000 | 0.368 | 0.411 | 0.221 | ||
| 3 spectra, GSVEEDILER | 0.000 | 0.000 | 0.000 | 0.000 | 0.000 | 0.000 | 0.389 | 0.611 | ||
| 2 spectra, VLIFSQMVR | 0.000 | 0.000 | 0.000 | 0.000 | 0.000 | 0.000 | 0.106 | 0.894 | ||
| 1 spectrum, AETHENEPGPLTVGDELLSQFK | 0.000 | 0.000 | 0.000 | 0.000 | 0.150 | 0.000 | 0.483 | 0.367 | ||
| 2 spectra, EWDHYR | 0.000 | 0.000 | 0.000 | 0.265 | 0.000 | 0.000 | 0.345 | 0.389 | ||
| 2 spectra, MVLDHLVIQR | 0.000 | 0.000 | 0.000 | 0.000 | 0.000 | 0.000 | 0.226 | 0.774 | ||
| 1 spectrum, DAELVDK | 0.000 | 0.000 | 0.000 | 0.262 | 0.000 | 0.000 | 0.217 | 0.521 | ||
| 1 spectrum, SIPSDPEER | 0.000 | 0.000 | 0.000 | 0.203 | 0.000 | 0.000 | 0.366 | 0.431 | ||
| 2 spectra, QFPFQR | 0.000 | 0.000 | 0.000 | 0.026 | 0.013 | 0.109 | 0.463 | 0.388 |
| Plot | Mito | Lyso or Perox | ER | Golgi | PM | Cytosol | Nucleus | ||||||
| Expt B |
1 peptide |
2 spectra |
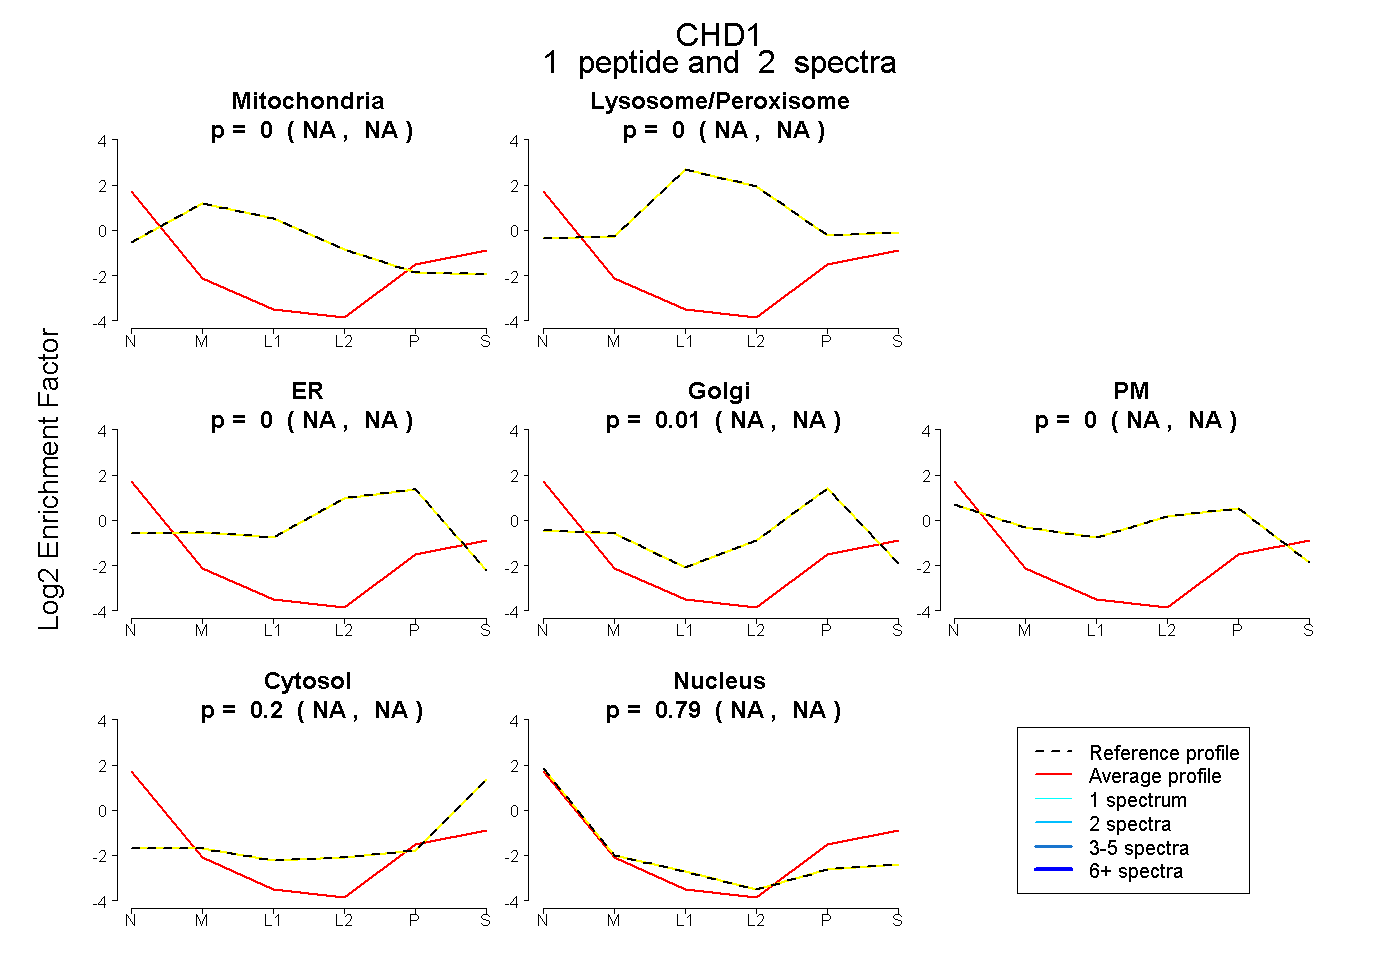 |
0.000 NA | NA |
0.000 NA | NA |
0.000 NA | NA |
0.009 NA | NA |
0.000 NA | NA |
0.198 NA | NA |
0.793 NA | NA |
|||
| Plot | Lyso | Other | |||||||||||
| Expt C |
3 peptides |
3 spectra |
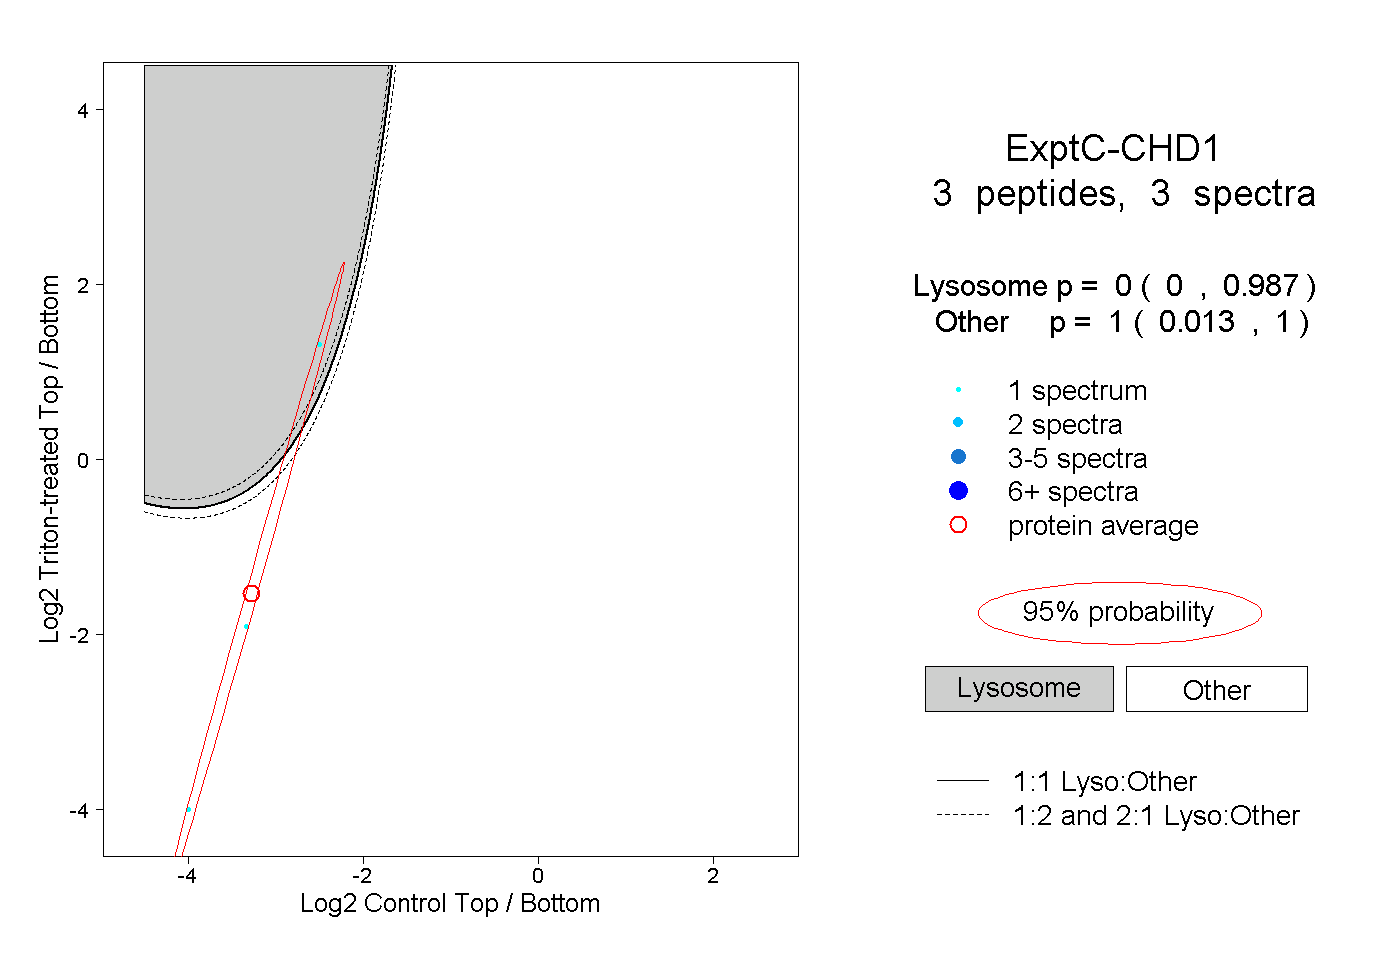 |
0.000 0.000 | 0.987 |
1.000 0.013 | 1.000 |