 6
6peptides
spectra
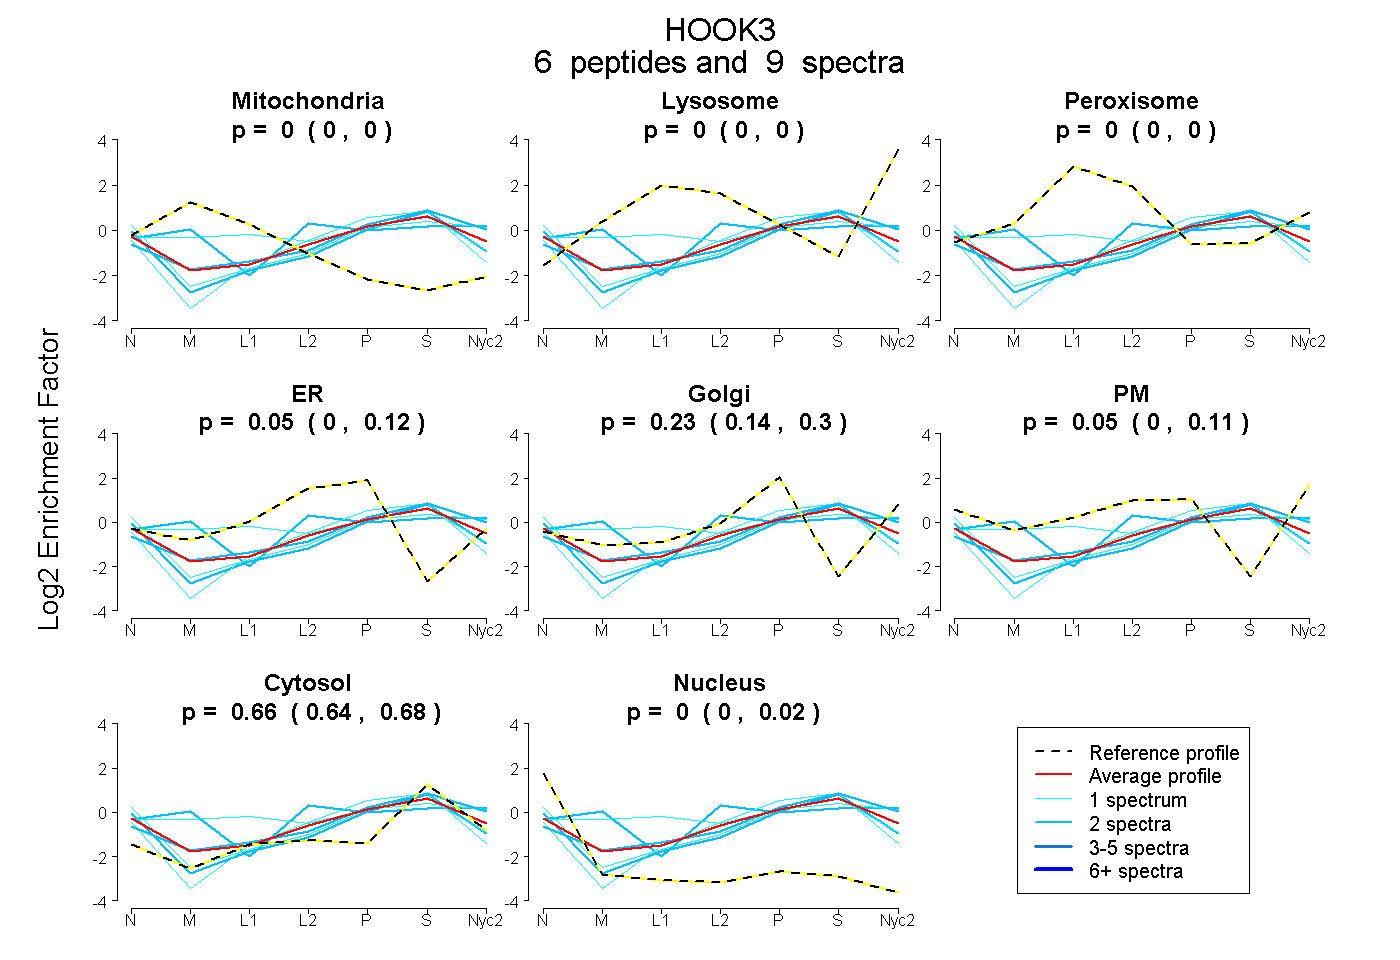
0.000 | 0.000
0.000 | 0.000
0.000 | 0.000
0.000 | 0.125
0.140 | 0.298
0.000 | 0.112
0.639 | 0.676
0.000 | 0.020
2peptides
spectra
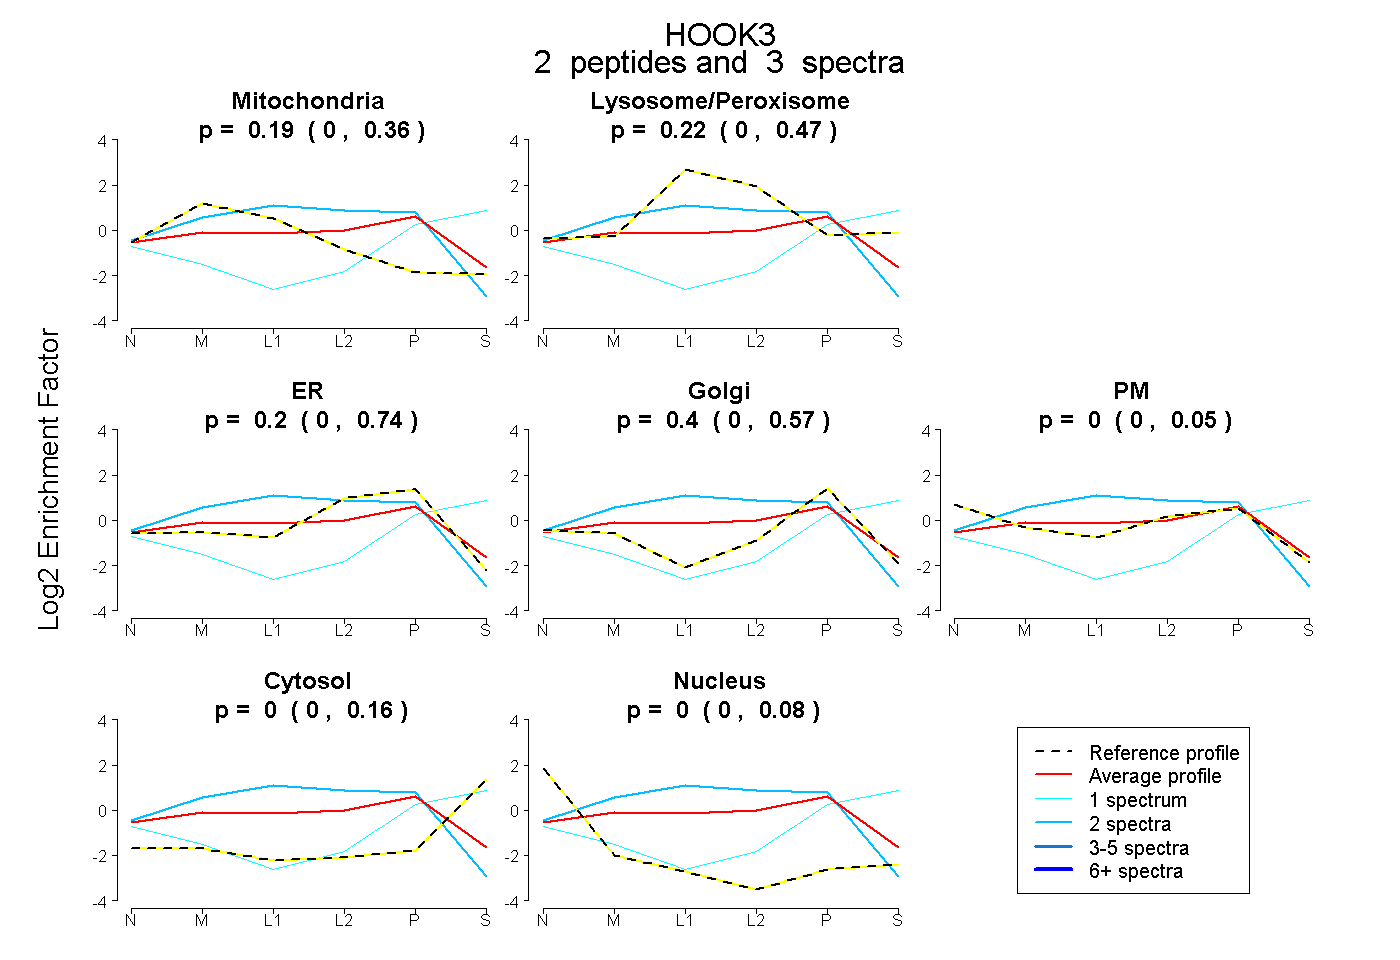
0.000 | 0.356
0.000 | 0.471
0.000 | 0.736
0.000 | 0.572
0.000 | 0.055
0.000 | 0.158
0.000 | 0.077
10peptides
spectra
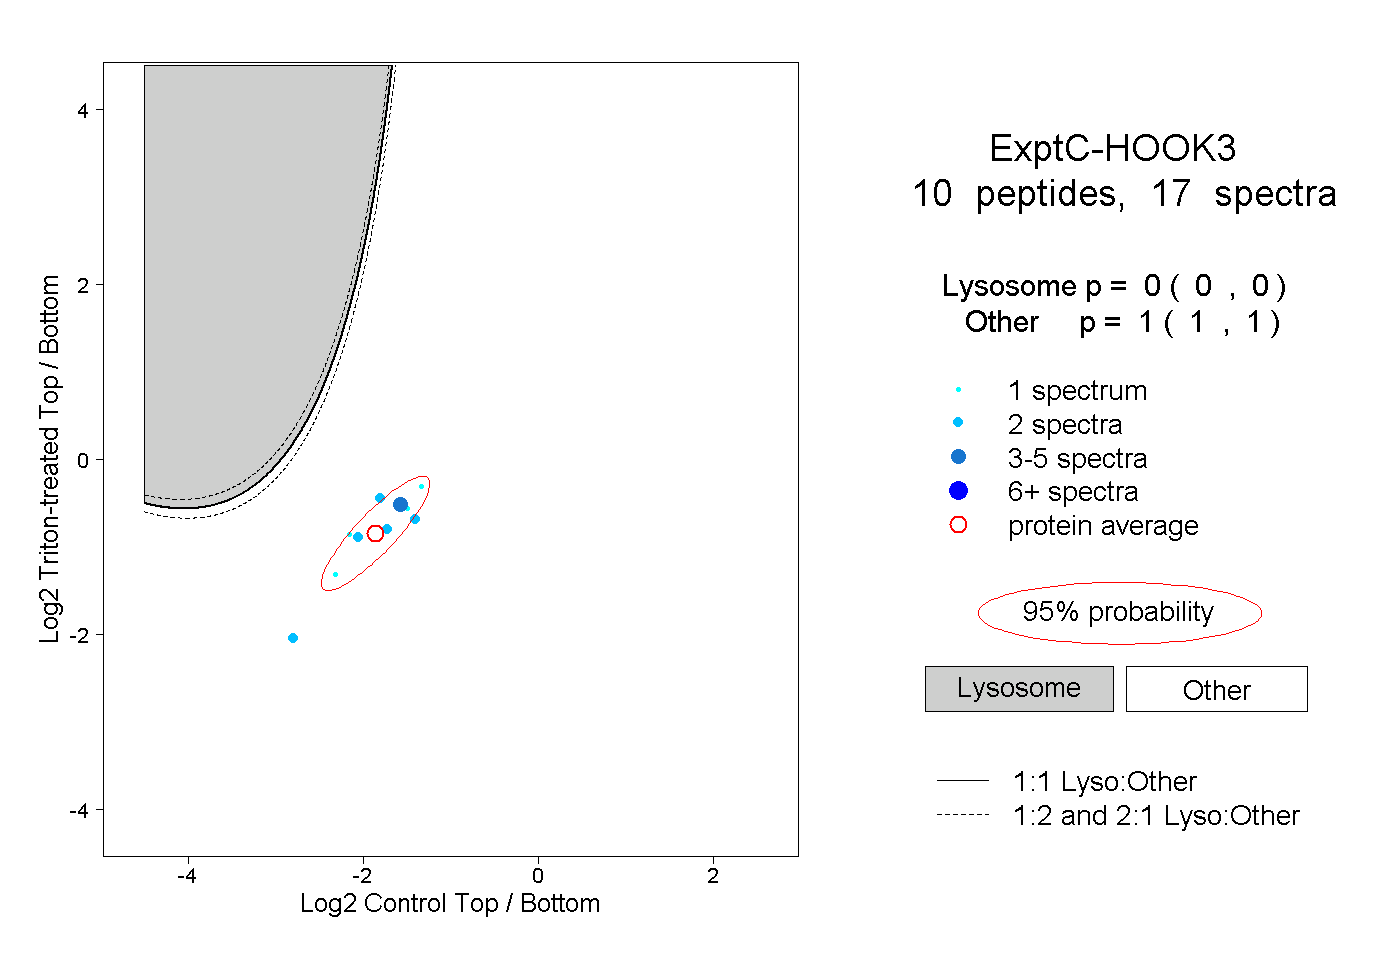
0.000 | 0.000
1.000 | 1.000
1peptide
spectra
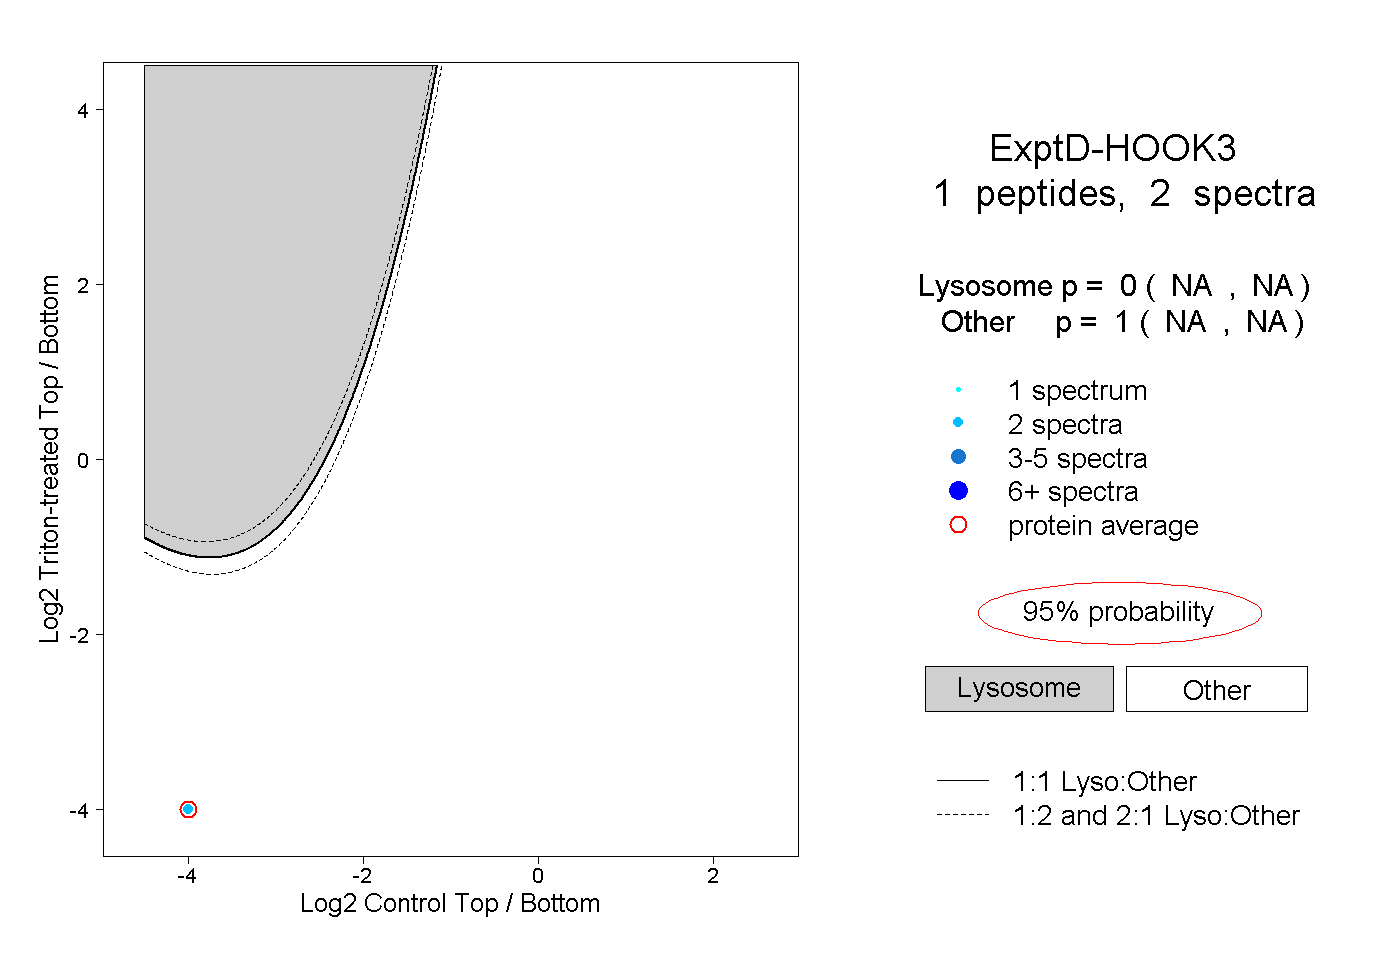
NA | NA
NA | NA