17
17peptides
spectra
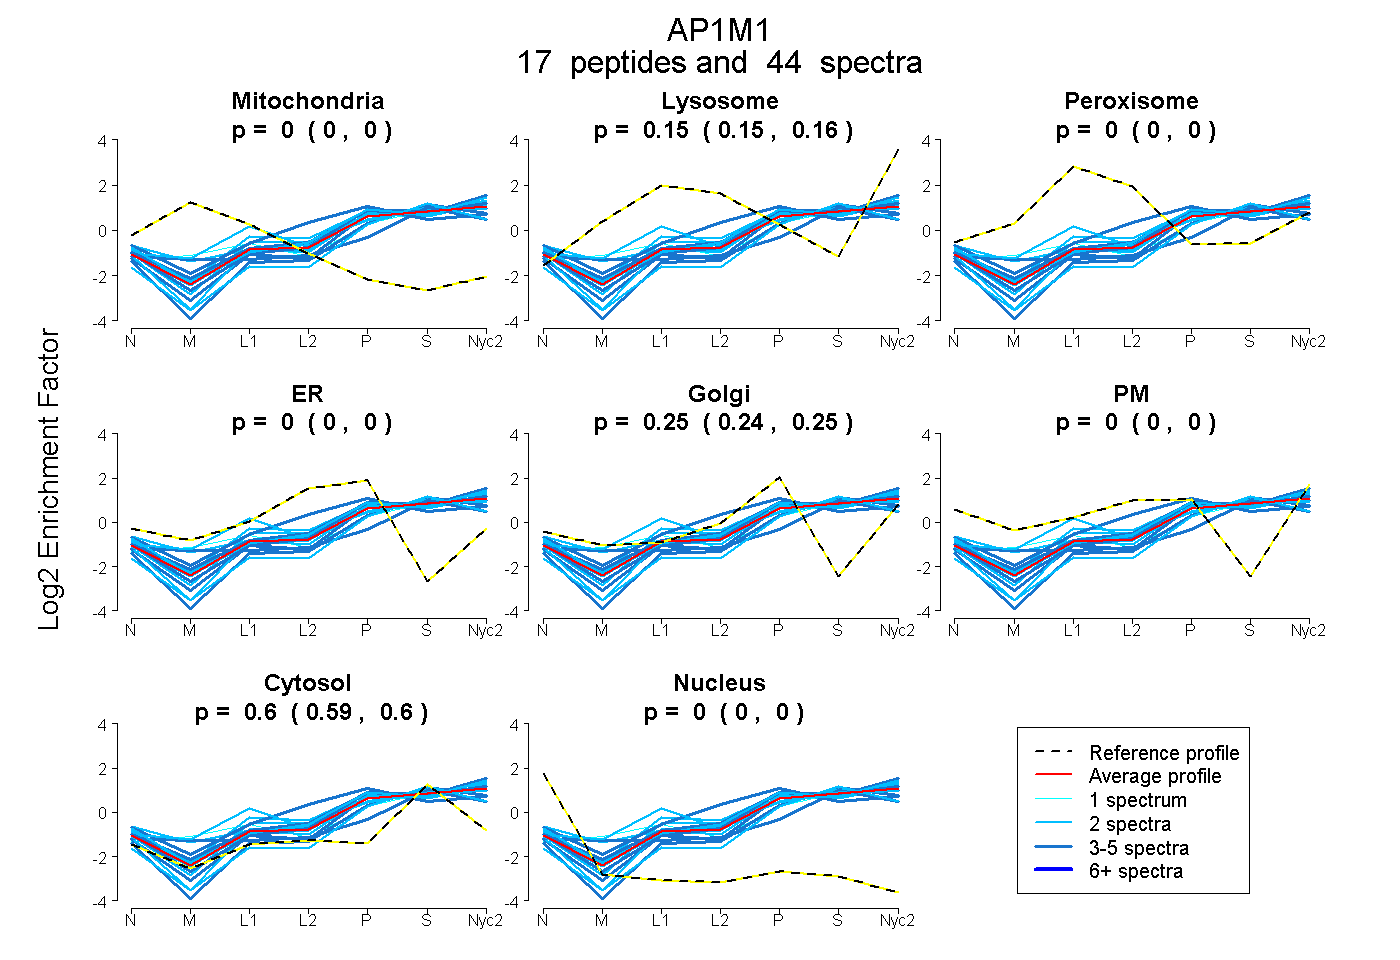
0.000 | 0.000
0.148 | 0.160
0.000 | 0.000
0.000 | 0.000
0.241 | 0.251
0.000 | 0.000
0.595 | 0.603
0.000 | 0.000
9peptides
spectra
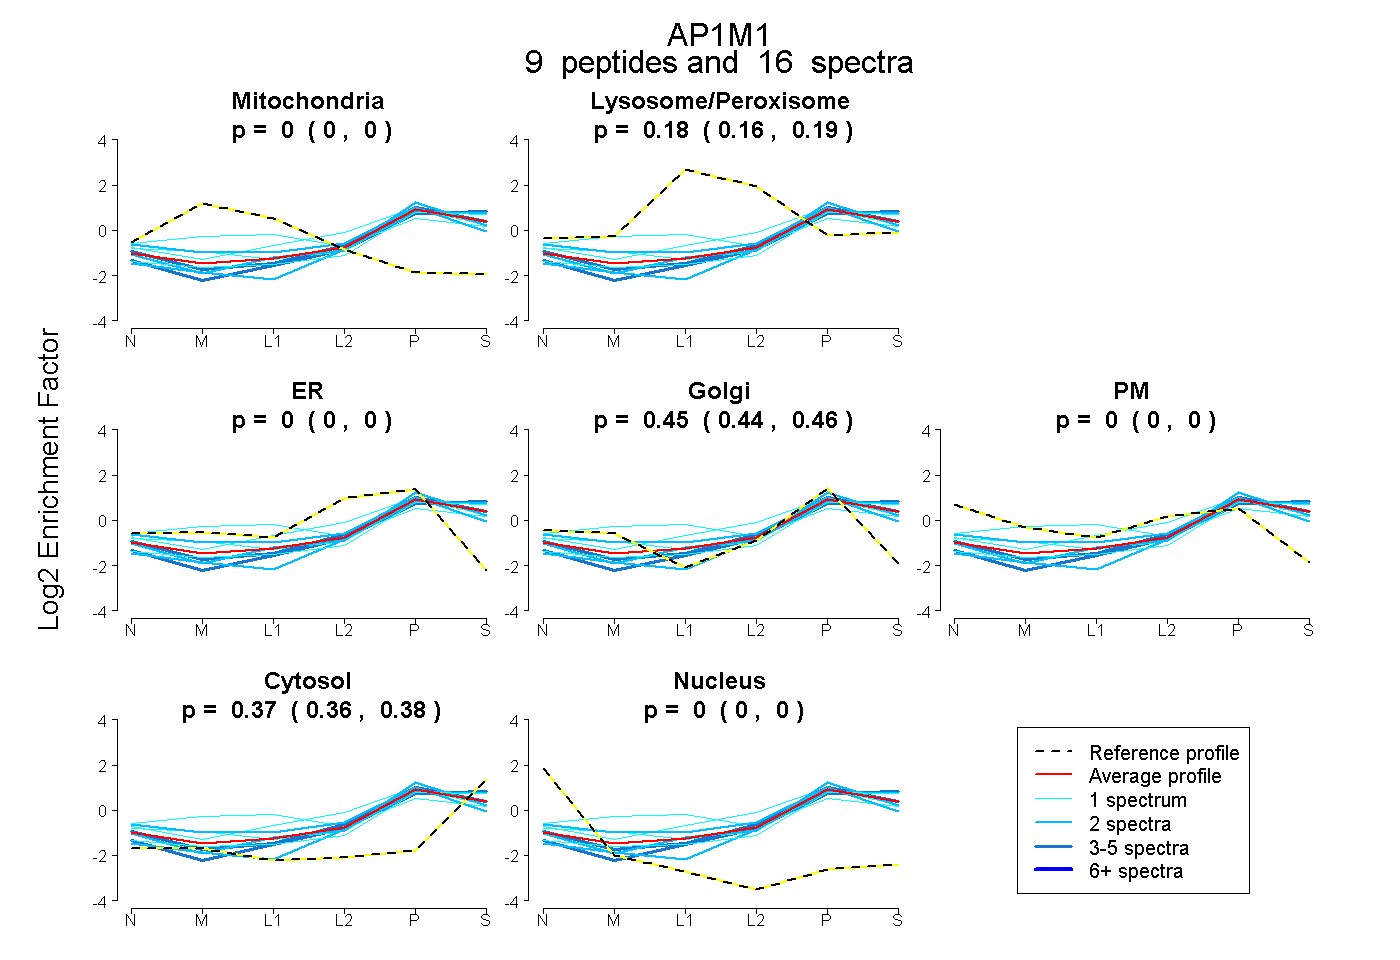
0.000 | 0.000
0.164 | 0.187
0.000 | 0.000
0.439 | 0.462
0.000 | 0.000
0.362 | 0.380
0.000 | 0.000
19peptides
spectra
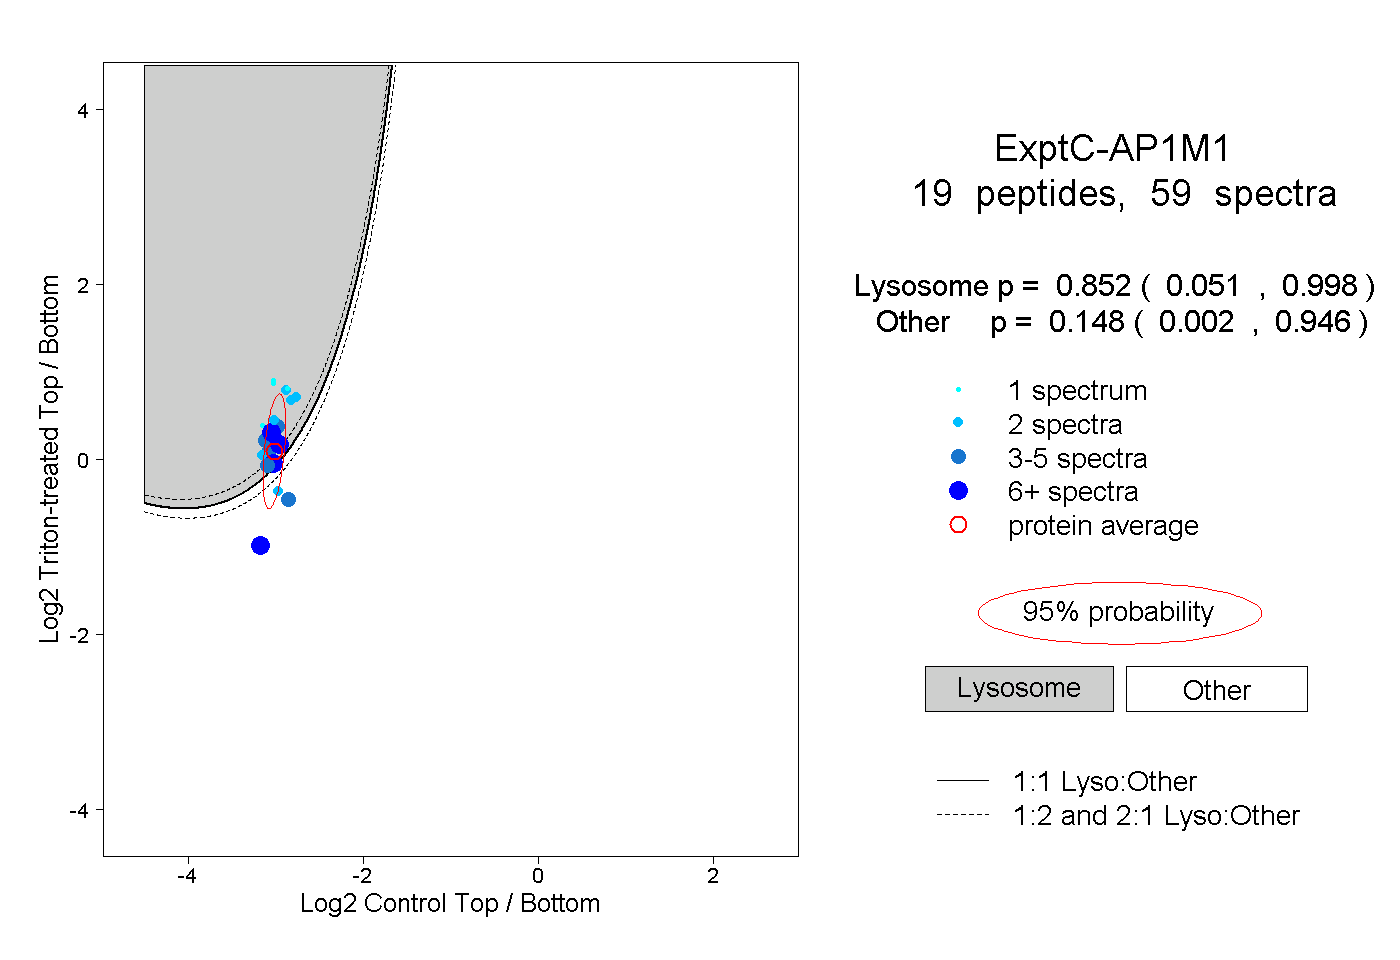
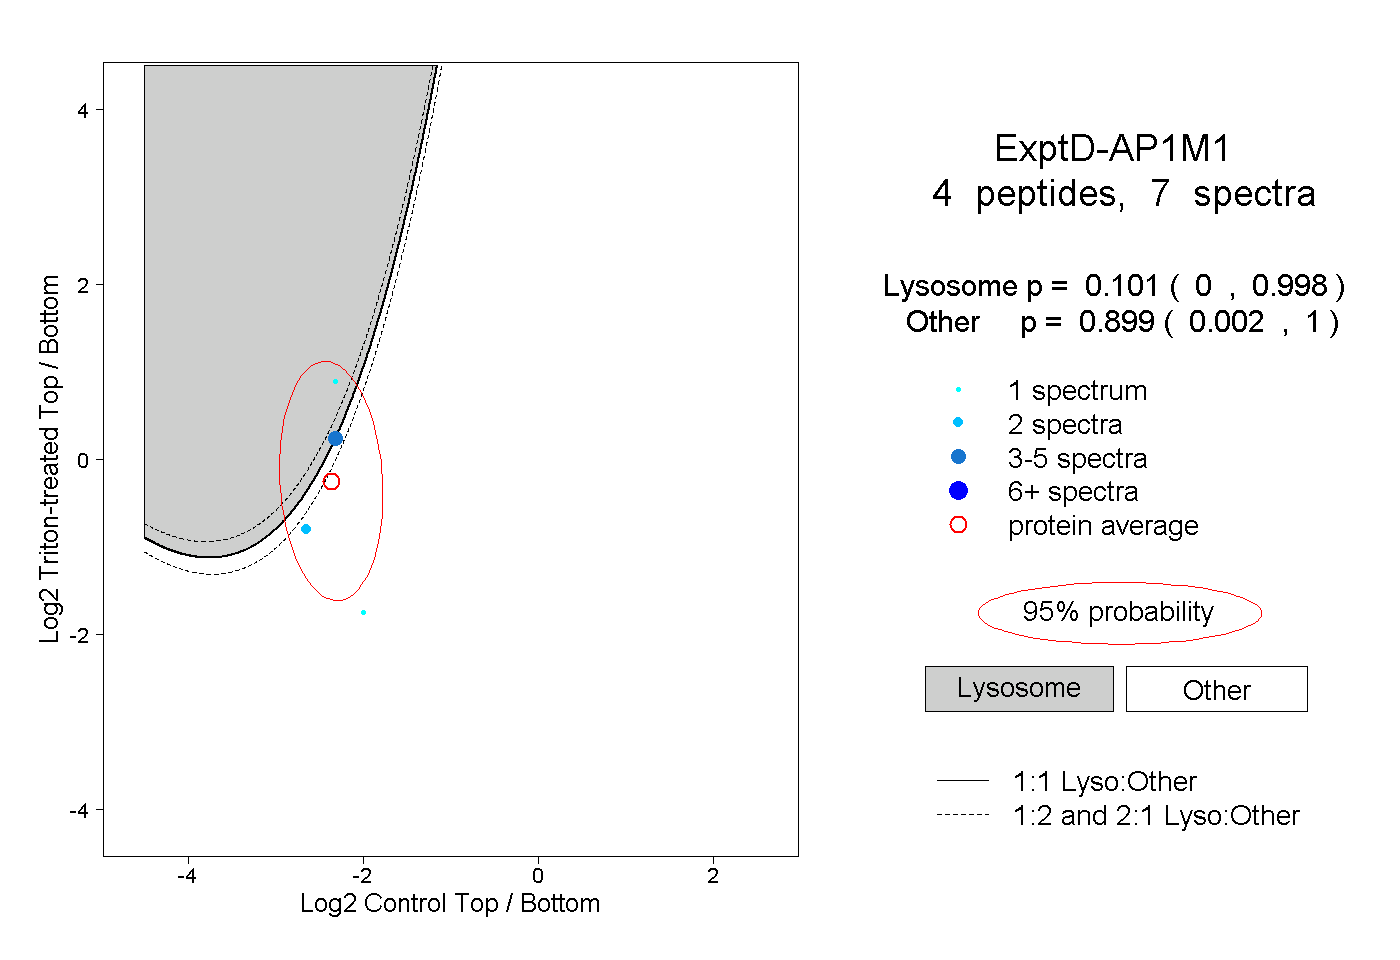
0.051 | 0.998
0.002 | 0.946