A2M
[ENSRNOP00000019346]
Main page
| | | Plot |
Mito |
Lyso |
|
Perox |
ER |
Golgi |
PM |
Cytosol |
Nucleus |
|
| Expt A |
 4
4
peptides |
6
spectra |
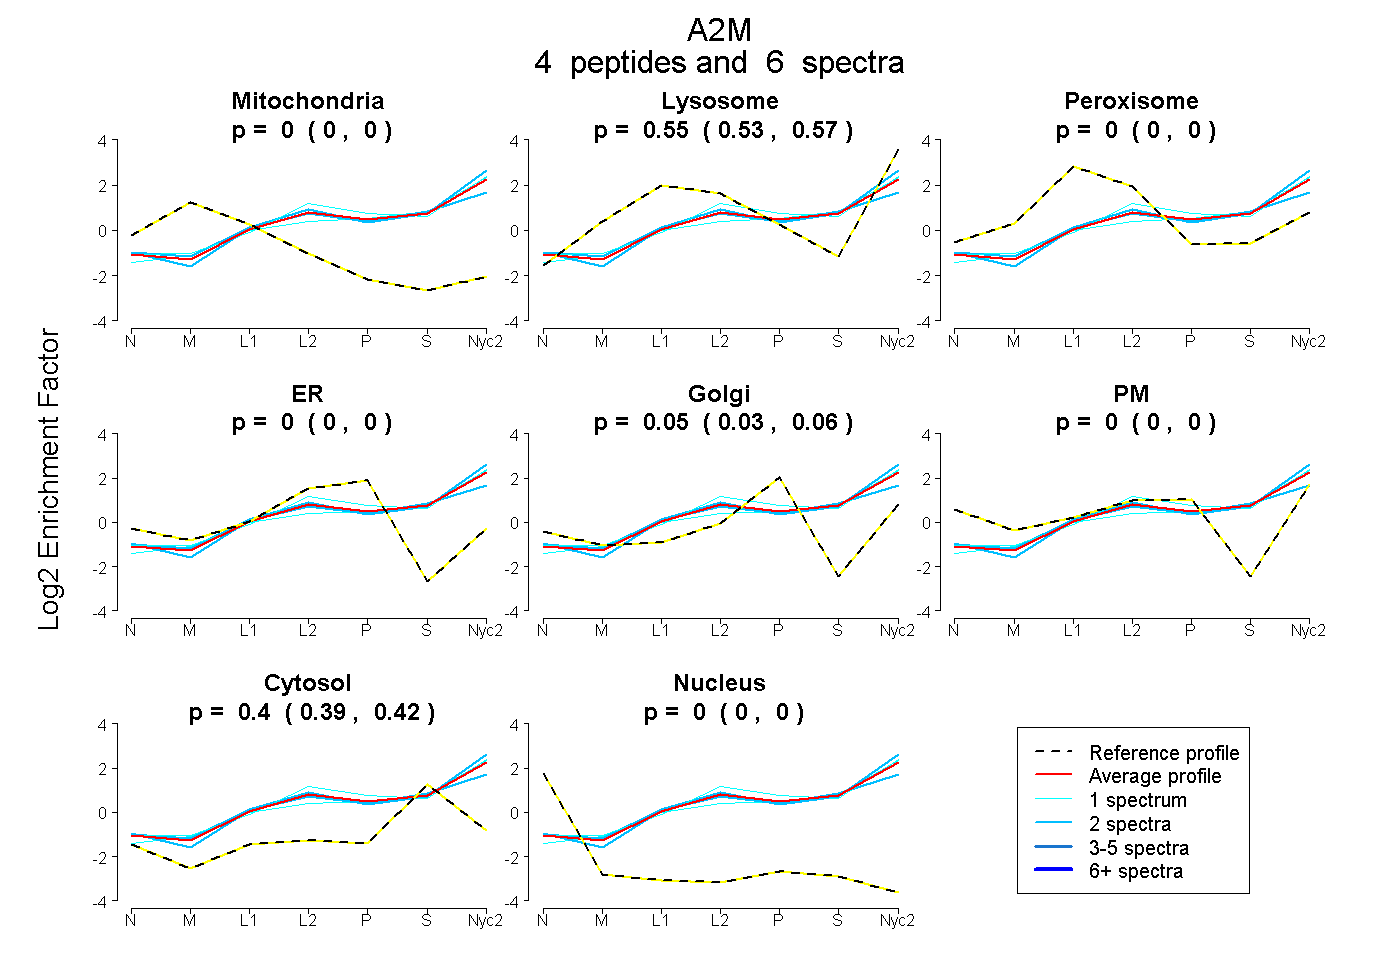 |
0.000
0.000 | 0.000 |
0.549
0.527 | 0.569 |
|
0.000
0.000 | 0.000 |
0.000
0.000 | 0.000 |
0.048
0.031 | 0.062 |
0.000
0.000 | 0.000 |
0.402
0.387 | 0.416 |
0.000
0.000 | 0.000 |
|
| | | Plot |
|
Lyso |
|
|
|
|
|
|
|
Other |
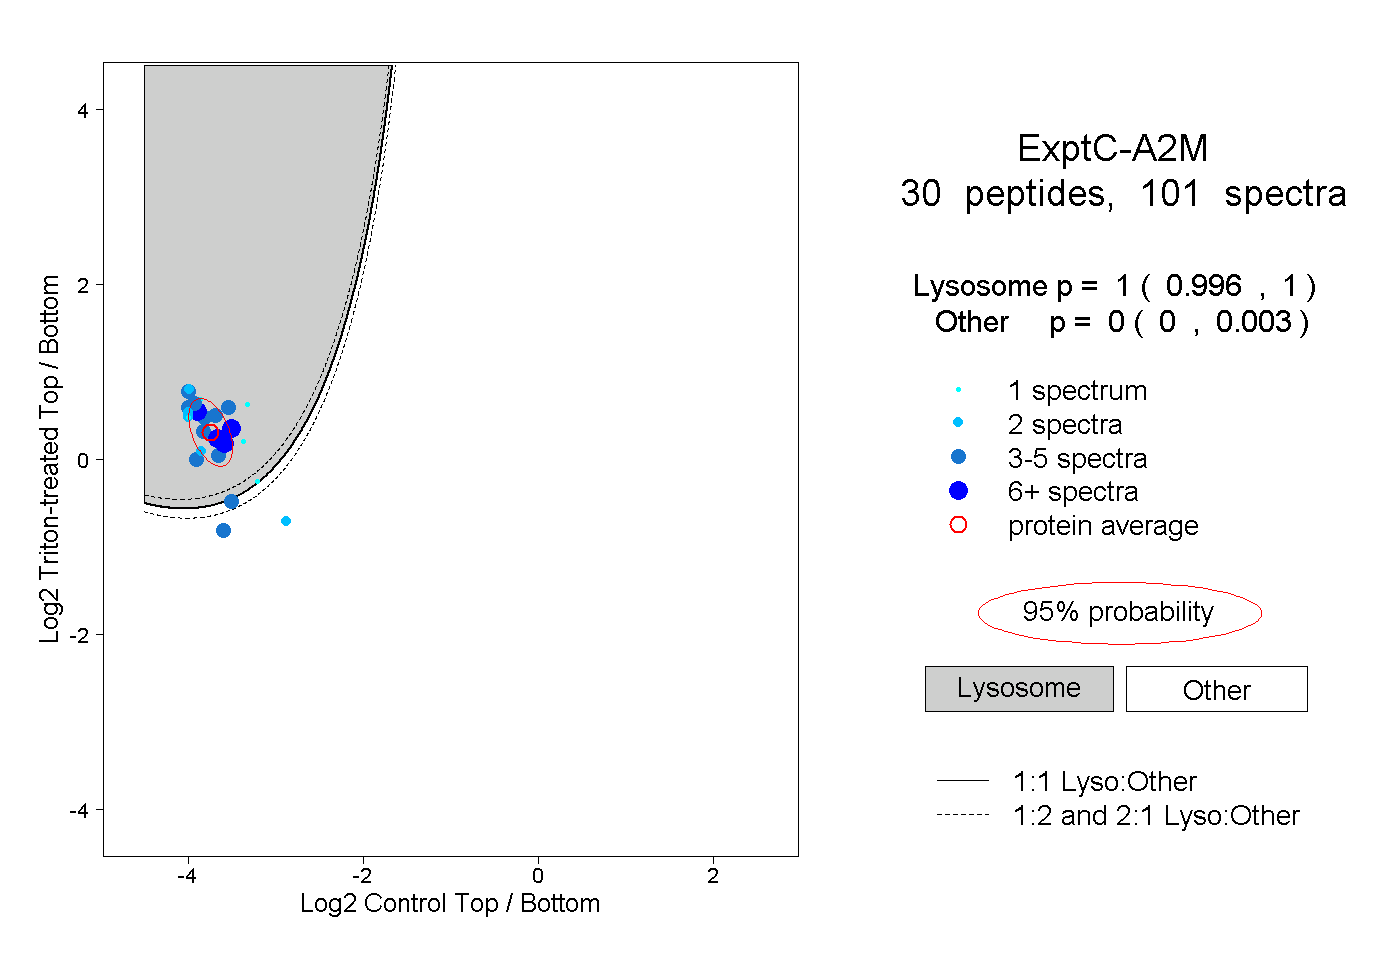
| Expt C |
30
peptides |
101
spectra |
 |
|
1.000
0.996 | 1.000 |
|
|
|
|
|
|
|
0.000
0.000 | 0.003 |
| | | Plot |
|
Lyso |
|
|
|
|
|
|
|
Other |
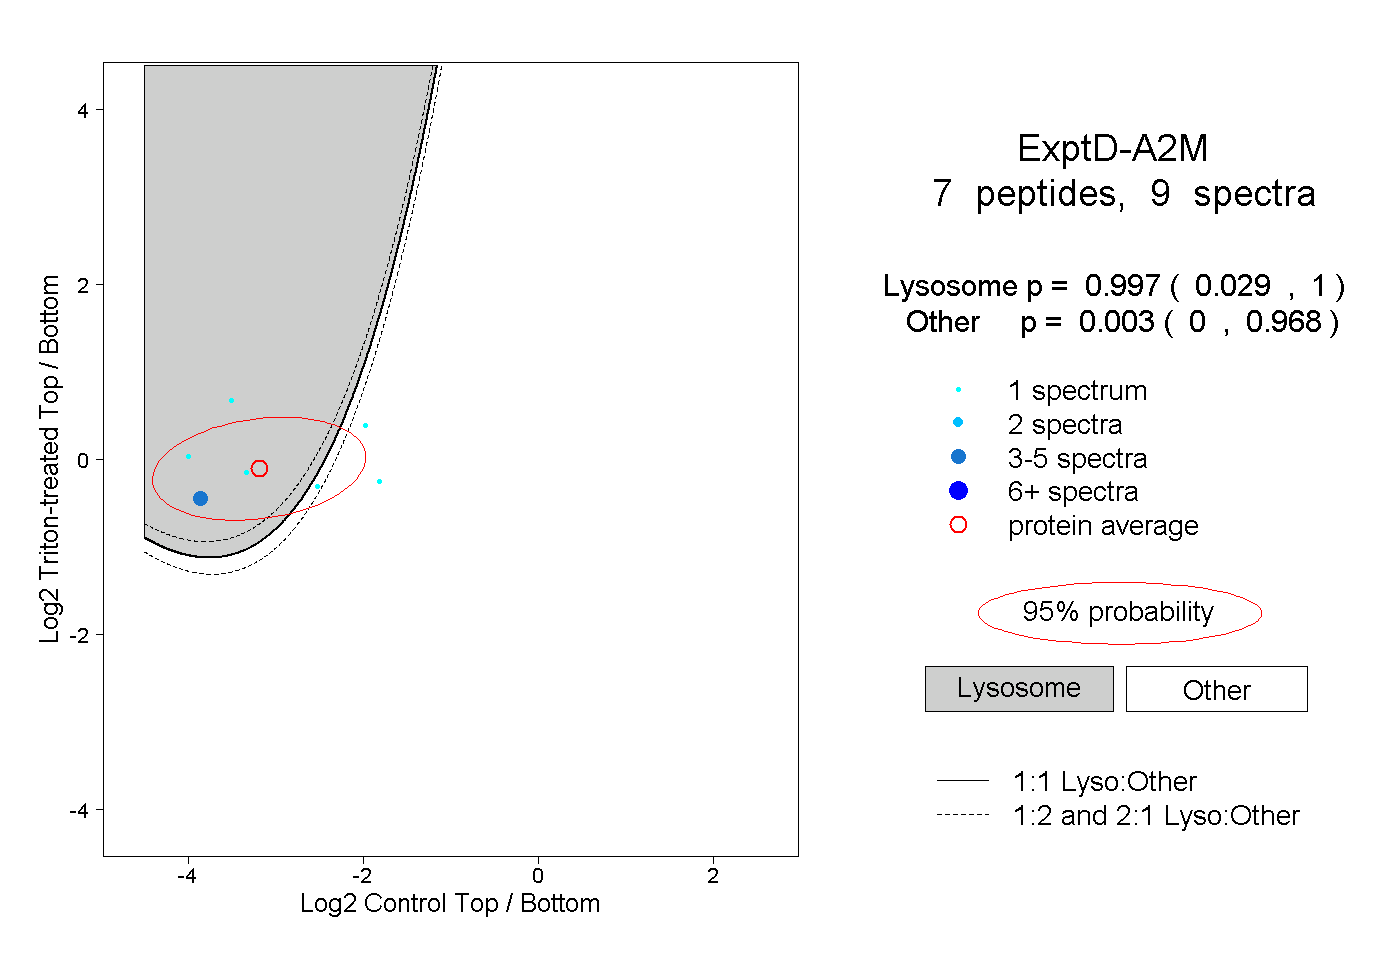
| Expt D |
7
peptides |
9
spectra |
 |
|
0.997
0.029 | 1.000 |
|
|
|
|
|
|
|
0.003
0.000 | 0.968 |
| 1 spectrum, GGAGGSHVYTK |
|
0.998 |
|
|
|
|
|
|
|
0.002 |
| 3 spectra, GCFSQLVK |
|
0.994 |
|
|
|
|
|
|
|
0.006 |
| 1 spectrum, VTVNICR |
|
0.286 |
|
|
|
|
|
|
|
0.714 |
| 1 spectrum, VFTNSNIR |
|
0.019 |
|
|
|
|
|
|
|
0.981 |
| 1 spectrum, LPSDVVEESAR |
|
1.000 |
|
|
|
|
|
|
|
0.000 |
| 1 spectrum, YEIENCLANK |
|
1.000 |
|
|
|
|
|
|
|
0.000 |
| 1 spectrum, YSVLPR |
|
0.000 |
|
|
|
|
|
|
|
1.000 |