 4
4peptides
spectra
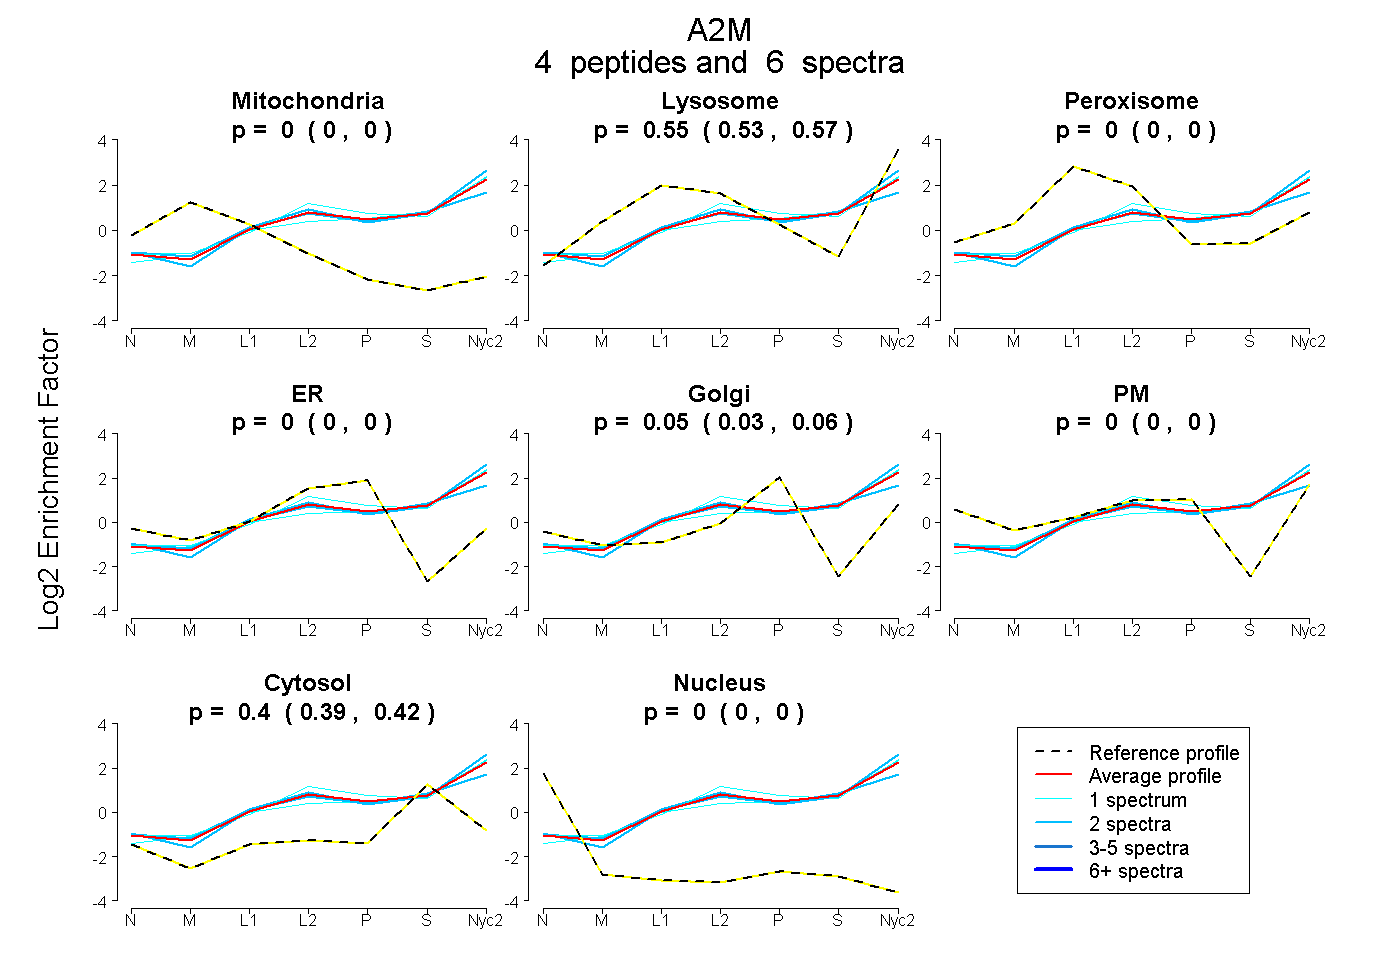
0.000 | 0.000
0.527 | 0.569
0.000 | 0.000
0.000 | 0.000
0.031 | 0.062
0.000 | 0.000
0.387 | 0.416
0.000 | 0.000
30peptides
spectra
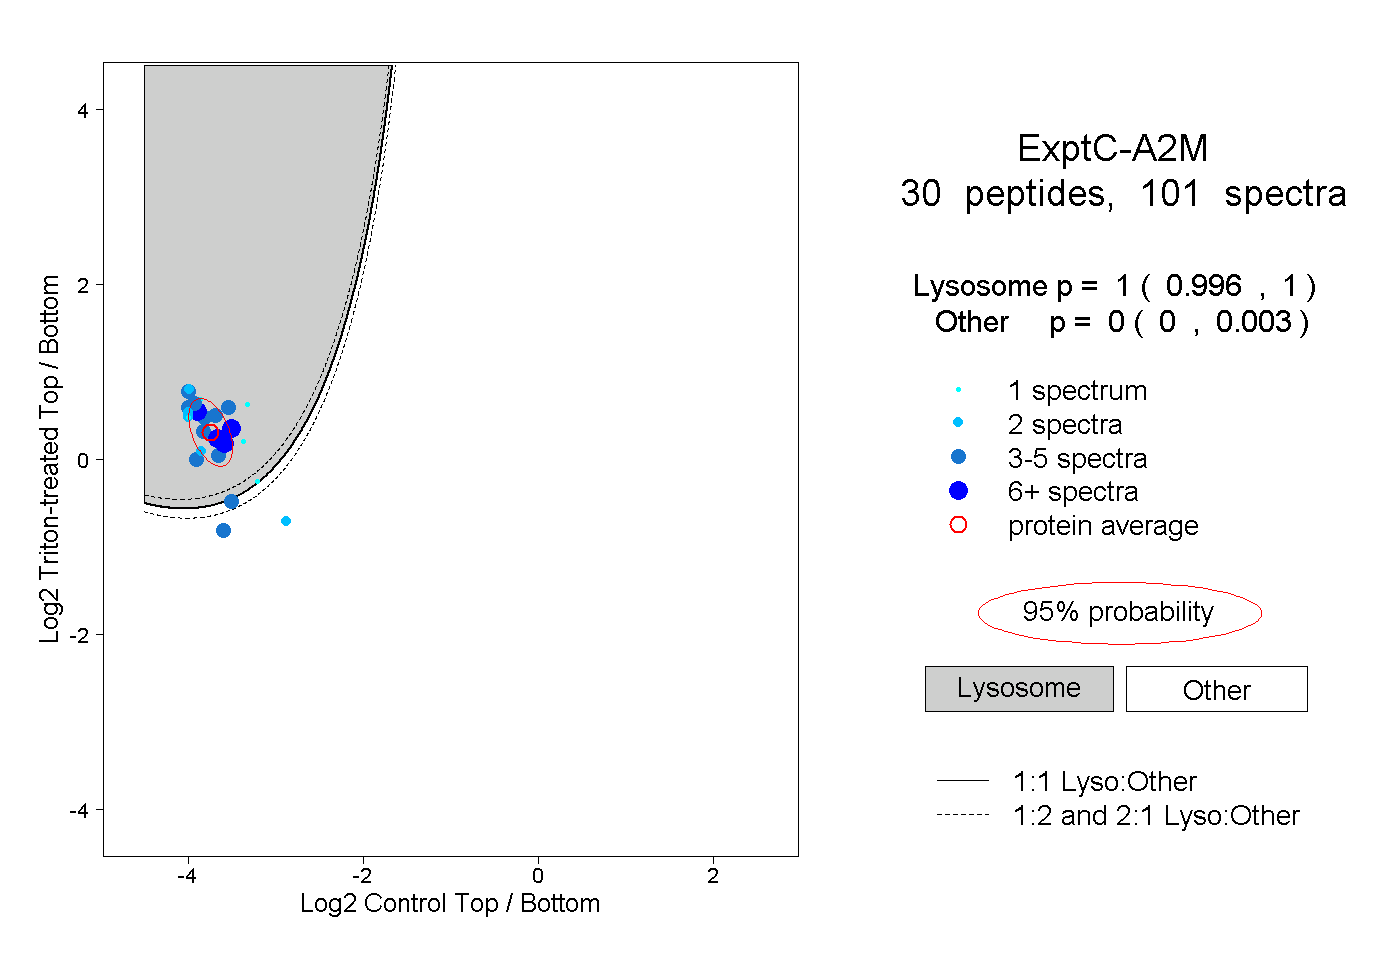
0.996 | 1.000
0.000 | 0.003
7peptides
spectra
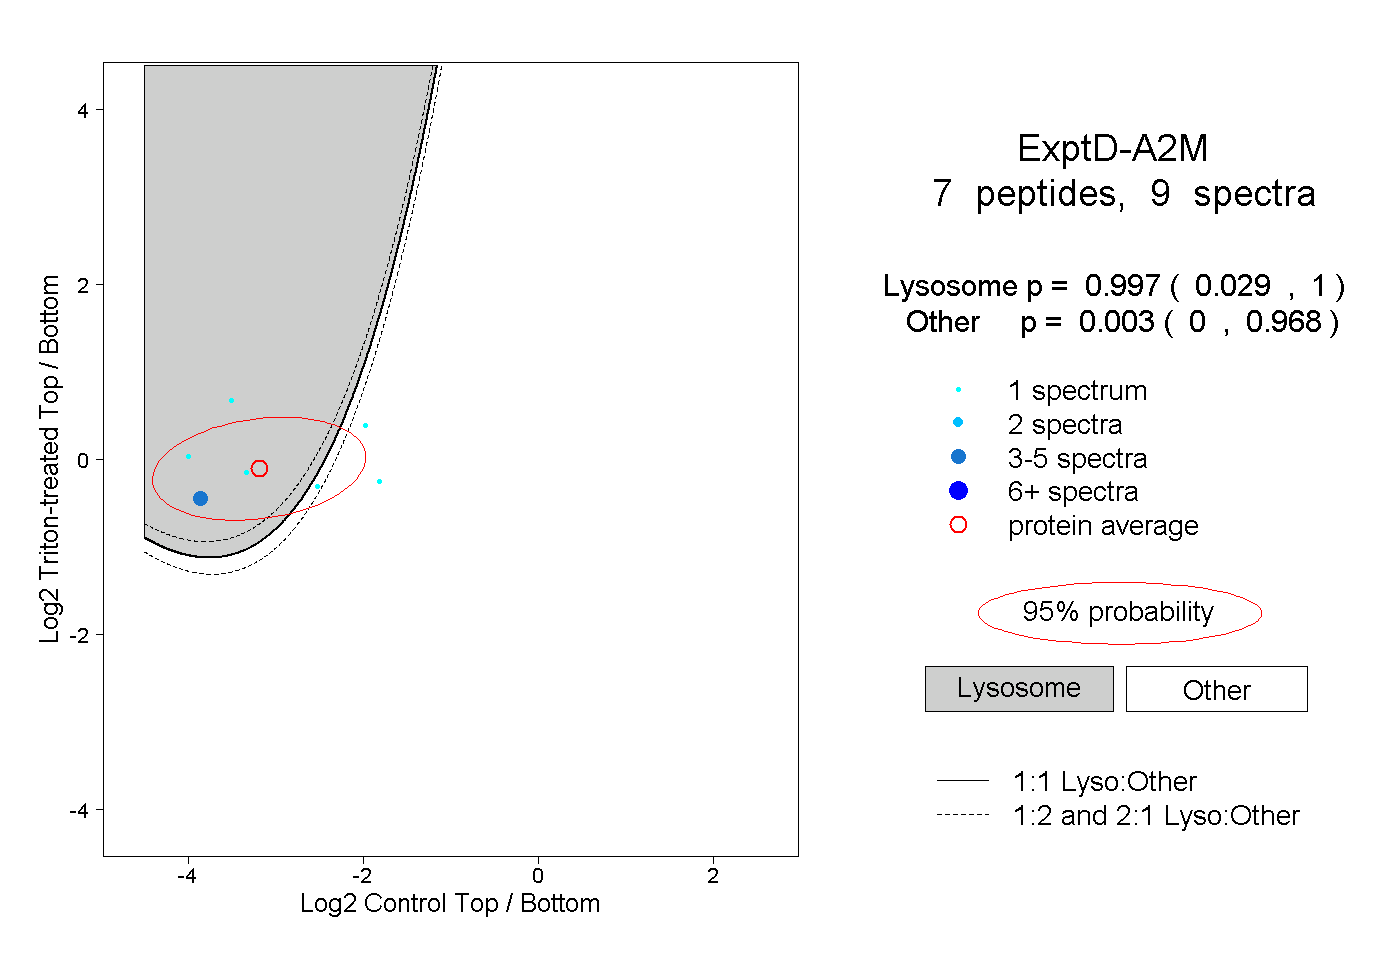
0.029 | 1.000
0.000 | 0.968