4
4peptides
spectra
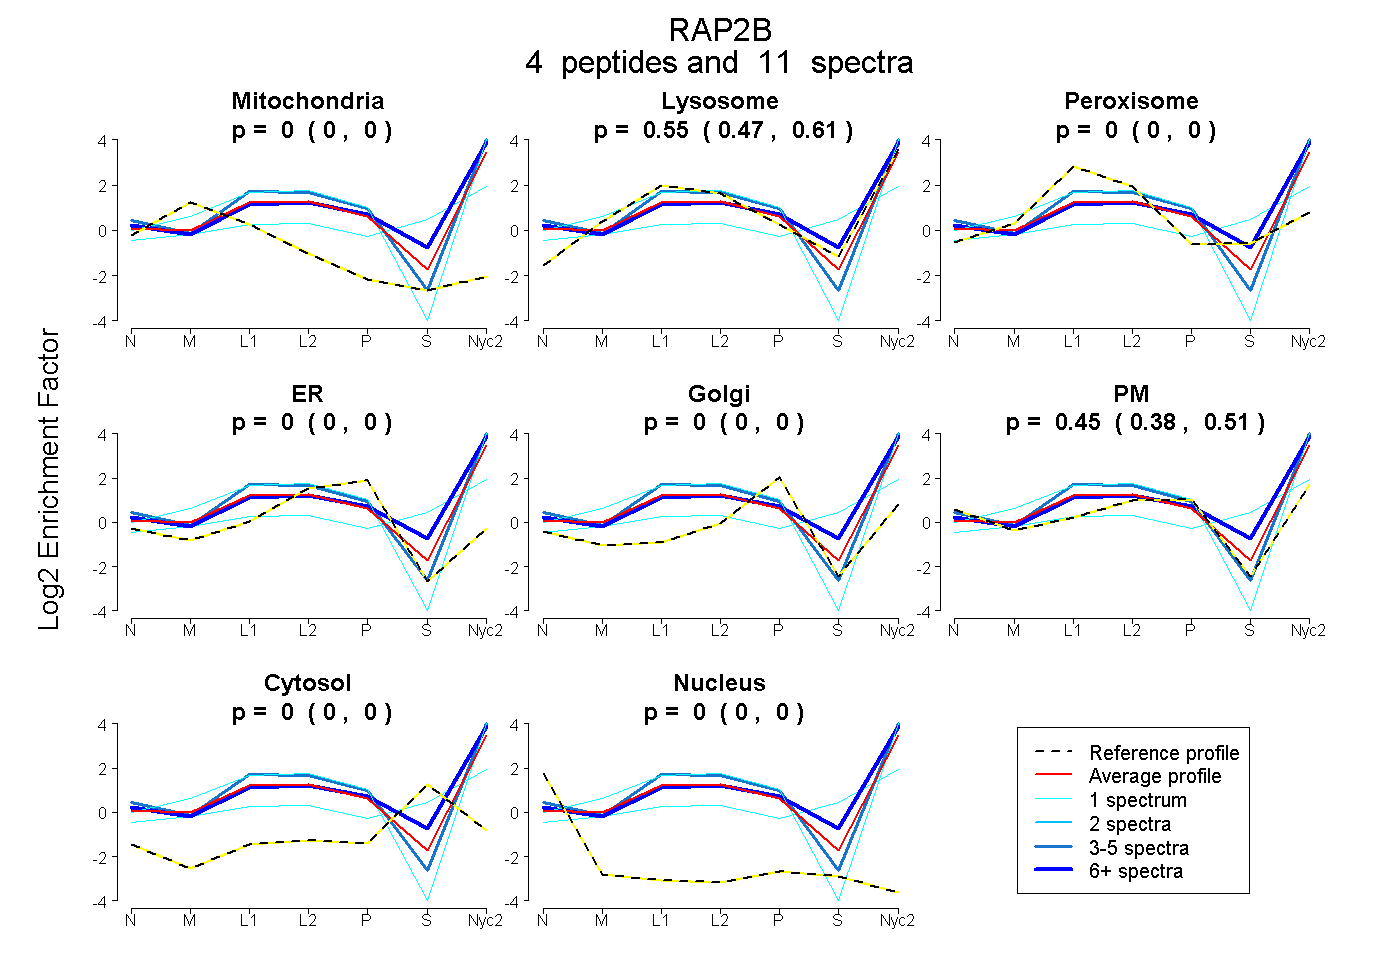
0.000 | 0.000
0.474 | 0.606
0.000 | 0.000
0.000 | 0.000
0.000 | 0.000
0.382 | 0.512
0.000 | 0.000
0.000 | 0.000
3peptides
spectra
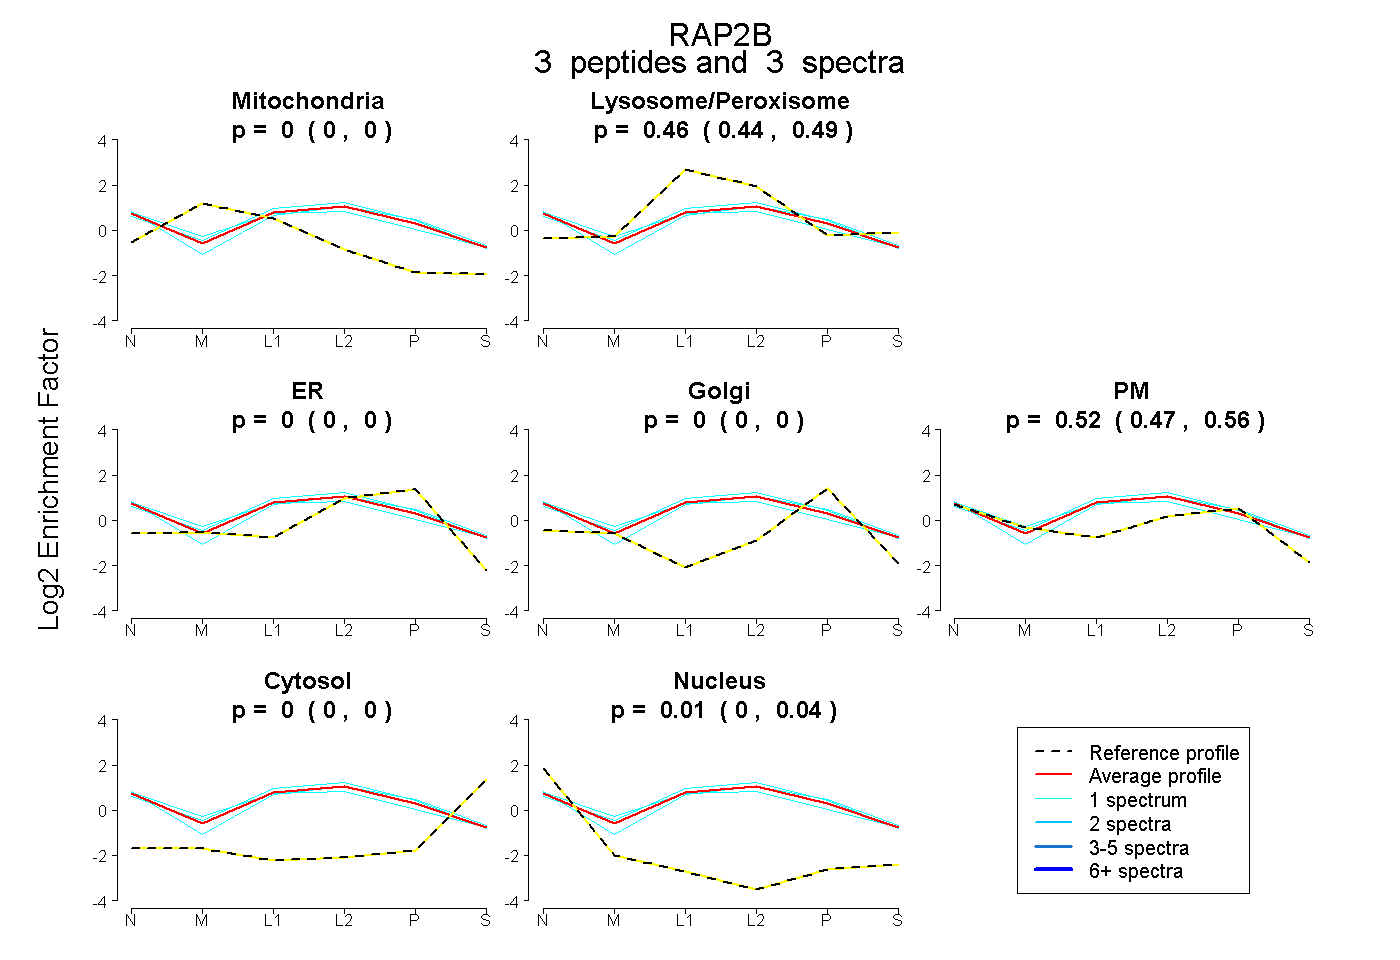
0.000 | 0.000
0.439 | 0.488
0.000 | 0.000
0.000 | 0.000
0.465 | 0.555
0.000 | 0.000
0.000 | 0.042